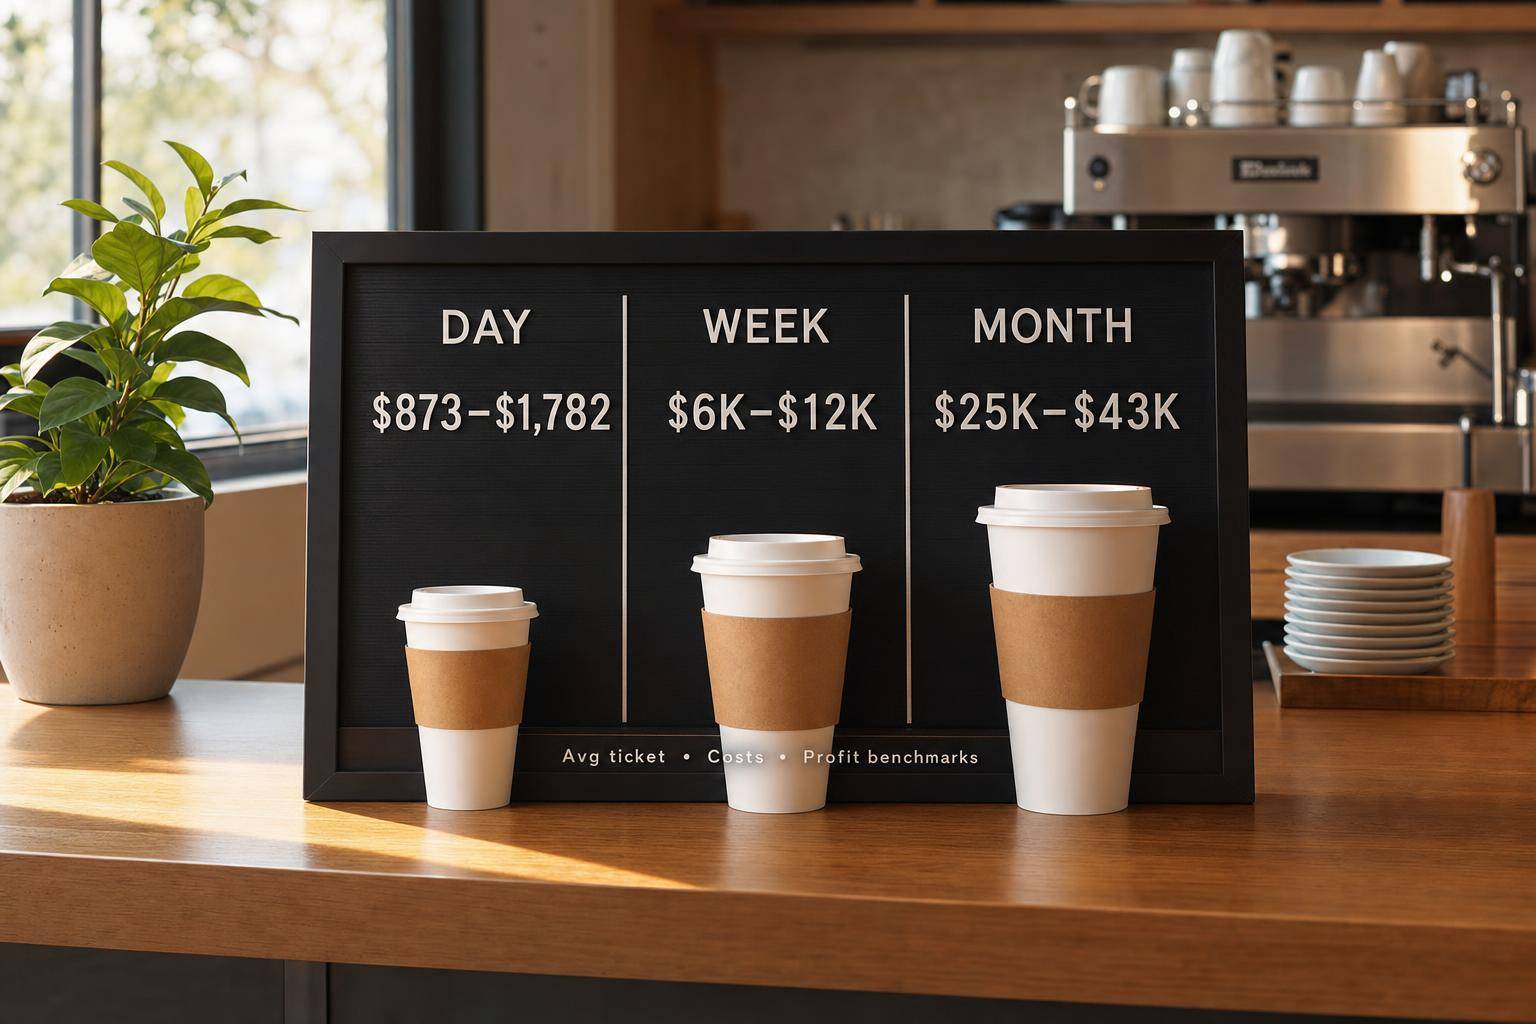
If you want the short answer: many U.S. coffee shops bring in about $873 to $1,782 per day, or roughly $25,000 to $42,780 per month in gross sales. That is sales before expenses, not take-home profit. Most shops end up with only 3% to 10% net profit, while tighter-run stores may reach 15% to 25%.
If I were sizing up a coffee shop idea, I’d focus on four numbers right away:
- Daily sales: often $873 to $1,782 for small to mid-sized shops
- Monthly sales: often $25,000 to $42,780
- Average ticket: about $11.11 per order
- Main cost ranges: labor 20% to 35%, rent 10% to 15%, and COGS 30% to 35%
The article also shows that sales change a lot by shop type:
- Small kiosk or micro bar: about $25,000 to $30,000/month
- Neighborhood cafe: about $35,000 to $42,780/month
- High-traffic or drive-thru shop: about $83,333 to $200,000+/month
What matters most is simple: customer count × average ticket × days open. So if I wanted a fast reality check, I’d use that math first, then test whether the sales can cover staff, rent, and ingredients.
| Shop type | Daily sales | Monthly sales |
|---|---|---|
| Small kiosk / micro bar | $873–$1,100 | $25,000–$30,000 |
| Neighborhood cafe | $1,200–$1,782 | $35,000–$42,780 |
| High-traffic / drive-thru | $2,740–$6,600+ | $83,333–$200,000+ |
Bottom line: a busy shop does not always mean strong profit. I’d use these ranges as a fast benchmark, then check whether the setup, traffic, and pricing make the numbers work.
Are Coffee Shops Profitable? A Look at the Numbers - 01/31/2024
sbb-itb-08dd11e
Coffee shop revenue ranges by business model
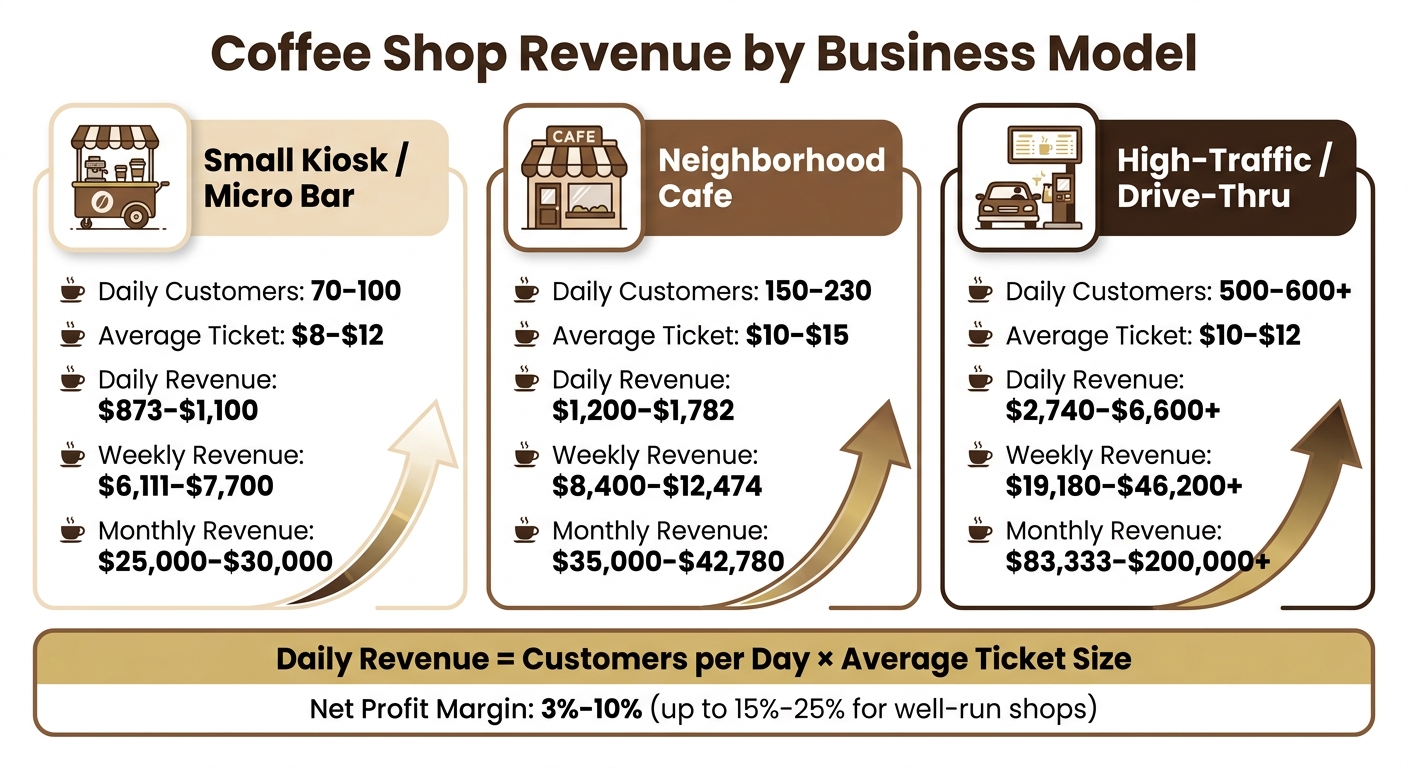
Coffee Shop Revenue by Business Model: Daily, Weekly & Monthly Breakdown
Your shop format shapes almost everything: how many people you serve, how much they spend, and what your sales can look like day to day.
Use the ranges below as a starting point when you map out your own coffee shop revenue.
Small kiosk or micro coffee bar
A kiosk or micro bar usually serves 70 to 100 customers per day, with an average ticket of $8 to $12. That puts estimated daily revenue at about $873 to $1,100, while monthly revenue tends to land around $25,000 to $30,000.
Neighborhood cafe with seating
A neighborhood cafe with seating often brings in 150 to 230 customers per day, with average tickets of $10 to $15. For this model, daily revenue usually falls between $1,200 and $1,782, which works out to about $35,000 to $42,780 per month.
High-traffic urban or drive-thru shop
In this model, customer volume tends to matter more than ticket size. High-traffic urban or drive-thru shops serve 500 to 600+ customers per day, with average tickets between $10 and $12. At that pace, daily revenue ranges from $2,740 to $6,600+, and monthly revenue can reach $83,333 to $200,000+.
| Shop Model | Daily Customers | Avg. Ticket | Est. Daily Revenue | Est. Weekly Revenue | Est. Monthly Revenue |
|---|---|---|---|---|---|
| Small Kiosk / Micro Bar | 70–100 | $8–$12 | $873–$1,100 | $6,111–$7,700 | $25,000–$30,000 |
| Neighborhood Cafe | 150–230 | $10–$15 | $1,200–$1,782 | $8,400–$12,474 | $35,000–$42,780 |
| High-Traffic / Drive-Thru | 500–600+ | $10–$12 | $2,740–$6,600+ | $19,180–$46,200+ | $83,333–$200,000+ |
Note: High-traffic estimates are extrapolated from annual-revenue and large-chain volume benchmarks.
Next, use your customer count and average ticket to work out your own daily, weekly, and monthly sales.
How to calculate daily, weekly, and monthly coffee shop revenue
Use these three formulas to turn the revenue ranges above into your own estimate:
- Daily Revenue = Customers per Day × Average Ticket Size
- Weekly Revenue = Daily Revenue × Days Open per Week
- Monthly Revenue = Daily Revenue × Trading Days per Month
Estimate daily sales from customer count and average ticket
Start with customer count. Look at your location’s foot traffic, your opening hours, and how many people your team can serve during the rush. A busy line means nothing if service slows to a crawl.
Then work out your average ticket. Don’t base it on coffee alone. Include the whole mix: drinks, pastries, sandwiches, and add-ons like extra shots or syrups. The average ticket size for a coffee shop transaction is about $11.11.
Here’s a simple example: 100 customers × $11.00 average ticket = $1,100 in daily revenue. That falls inside the usual small-to-medium range of $873 to $1,782 per day. If your estimate comes in far above or below that band, it’s a sign to double-check the concept, pricing, or traffic assumptions.
Convert daily sales into weekly and monthly figures
A shop open 7 days a week at $1,400 per day brings in $9,800 per week and about $42,000 per month. Open 6 days a week, and that drops to about $36,400 per month. For a low-margin business, that gap matters.
For planning, use 25 to 26 trading days for a 6-day schedule and 30 to 31 days for a 7-day schedule as your default assumptions.
These formulas give you a starting point. From there, your numbers depend on three things more than anything else: location, average ticket, and how fast you can serve people.
The main factors that change coffee shop revenue
Two coffee shops in the same city can bring in very different revenue. And those numbers can shift fast when foot traffic, ticket size, and service speed change. In most cases, the gap comes down to three things you can influence: traffic, ticket size, and throughput.
| Factor | Revenue Effect |
|---|---|
| Location & Traffic | Higher-traffic urban sites drive significantly more daily volume than suburban locations |
| Average Ticket Size | More revenue per customer raises daily and monthly sales |
| Menu Mix | High-margin beverages support revenue; food raises ticket size |
| Capacity & Speed | Throughput sets the sales ceiling during peak hours |
| Repeat Behavior | Regular customers create steadier weekly and monthly revenue |
Each one affects sales in a different way.
Location, foot traffic, and operating hours
Location sets the upper limit on volume. More traffic can lift daily sales, but only when the shop can handle that demand. A busy corner sounds great on paper, yet high rent can wipe out the upside. So the lift from a high-traffic spot has to beat the cost of being there.
Operating hours play a part too. If you're open during the morning commute and lunch rush, you have more chances to ring up sales. Even small schedule tweaks can move the needle.
Average ticket size, menu mix, and upsells
More revenue per customer adds up fast across a week or a month. That's why upsells matter. When staff suggest extra shots, specialty syrups, pastries, or a larger size, the average ticket goes up right away.
Menu mix matters just as much. If the menu leans too far toward food, revenue efficiency can slip. On the other hand, putting high-margin specialty drinks front and center helps keep ticket size and sales headed in the right direction.
Capacity, speed, and repeat customer behavior
Slow service puts a hard cap on revenue during rush periods. You can have a line out the door, but if equipment slows the team down, the bar backs up, or staffing isn't set up well, sales stall even when demand is there. Cross-training staff and adding mobile pickup orders are two direct ways to lift throughput without adding more space.
Regulars make revenue steadier from week to week and month to month. A loyal customer base smooths out swings in sales and makes staffing and planning easier. Digital loyalty programs can help bring people back more often and support steadier monthly revenue.
How to use these benchmarks to validate a coffee shop idea
Build a simple revenue test for your concept
Start with the benchmark that fits your setup: kiosk, neighborhood cafe, or high-traffic shop. Then look at the location you have in mind and estimate daily customer traffic based on what’s realistic, not the dream scenario.
From there, the math is simple:
- Daily customers × average ticket size = daily revenue
- Daily revenue × operating days = monthly revenue
That gives you a rough monthly sales estimate fast. If that number doesn’t cover rent, labor, and ingredients, the idea needs work before you spend money on a lease, espresso machines, or build-out.
Use IdeaFloat to turn benchmarks into a plan
If the rough math checks out, the next step is to test your idea against your market. Benchmarks help you get in the ballpark, but they don’t tell you what your street, your customers, or your pricing will look like.
Use IdeaFloat to test demand, size your market, shape your menu, and model pricing. Then check breakeven after fixed costs and startup costs. That’s where rough estimates start turning into something you can actually use.
With that setup, focus on the numbers that matter most.
Key numbers before you open
Revenue can look very different depending on the format. A small kiosk might bring in about $873 per day, while a neighborhood cafe can hit $1,782. Net profit margins for small shops often land between 3% and 10%, although well-run stores can get to 15% to 25%.
Use those ranges as a gut check. If your plan falls far outside the usual range for your model, or the numbers still don’t cover fixed costs, it’s a sign to rework the concept before opening.
FAQs
How much profit does a coffee shop actually keep?
Small to medium-sized coffee shops usually keep a net profit margin of 3% to 10%. In some cases, well-run shops can hit 25%.
That gap comes down to a simple balancing act. Coffee shops need strong beverage sales, since drinks often carry better margins, while keeping a close eye on big expenses like rent and labor.
A good rule of thumb:
- Rent should stay around 10% to 15% of revenue
- Labor usually lands between 20% and 35%
If those costs start creeping up, profits can shrink fast. That’s why tight cost control and regular cash flow checks matter so much.
How many customers do I need to break even?
Calculate your break-even point by dividing your monthly fixed costs, like rent, insurance, and salaries, by your contribution margin per cup. That margin is simply your selling price minus variable costs, such as beans, milk, and syrups.
Here’s what that looks like in practice: if your fixed costs are $10,000 per month and your contribution margin is $7 per cup, you’d need to sell about 1,429 cups per month to break even. That works out to roughly 48 cups per day.
What is a realistic first-year sales target?
A realistic first-year sales target for a coffee shop is about $45,000 per month.
That lines up pretty well with what many small to medium-sized shops bring in: $25,000 to $42,780 per month. Shops in busy, high-traffic spots can bring in more.
To see whether $45,000 a month makes sense for your setup, turn that number into daily sales goals based on your seating, foot traffic, staff, and hours. Then compare those goals with your breakeven point.
That simple check can tell you fast whether the target feels doable or if it’s a stretch for your first year.
Related Blog Posts
- How much do coffee shops make?
- Coffee Shop - Business Plan Template (2025)
- Coffee Shop (2025): Business Plan Template + Startup Costs
- Coffee Cart: Licences, Locations, Margins