Want to know exactly when your business will break even? IdeaFloat uses AI and real-time market data to predict your breakeven point in just 15 days. Here's how it works:
- Enter Your Data: Input fixed costs, variable costs, and pricing details.
- AI Analysis: The platform uses live market data to refine your financial model.
- Actionable Forecast: Get a detailed breakeven prediction and suggestions to optimize costs or pricing.
For example, IdeaFloat predicted I’d break even on March 15, 2025, requiring $47,200 in revenue. My actual revenue? $46,890 - just $310 off. It also identified cost savings, pricing adjustments, and new market opportunities that boosted my profits.
Why it matters: Breakeven analysis helps set realistic sales goals, price effectively, and plan for growth. With IdeaFloat, you skip the manual spreadsheets and get accurate insights fast.
Ready to save time and make smarter decisions? Let’s dive into the details.
Break Even Analysis - Simple for Startups and Entrepreneurs
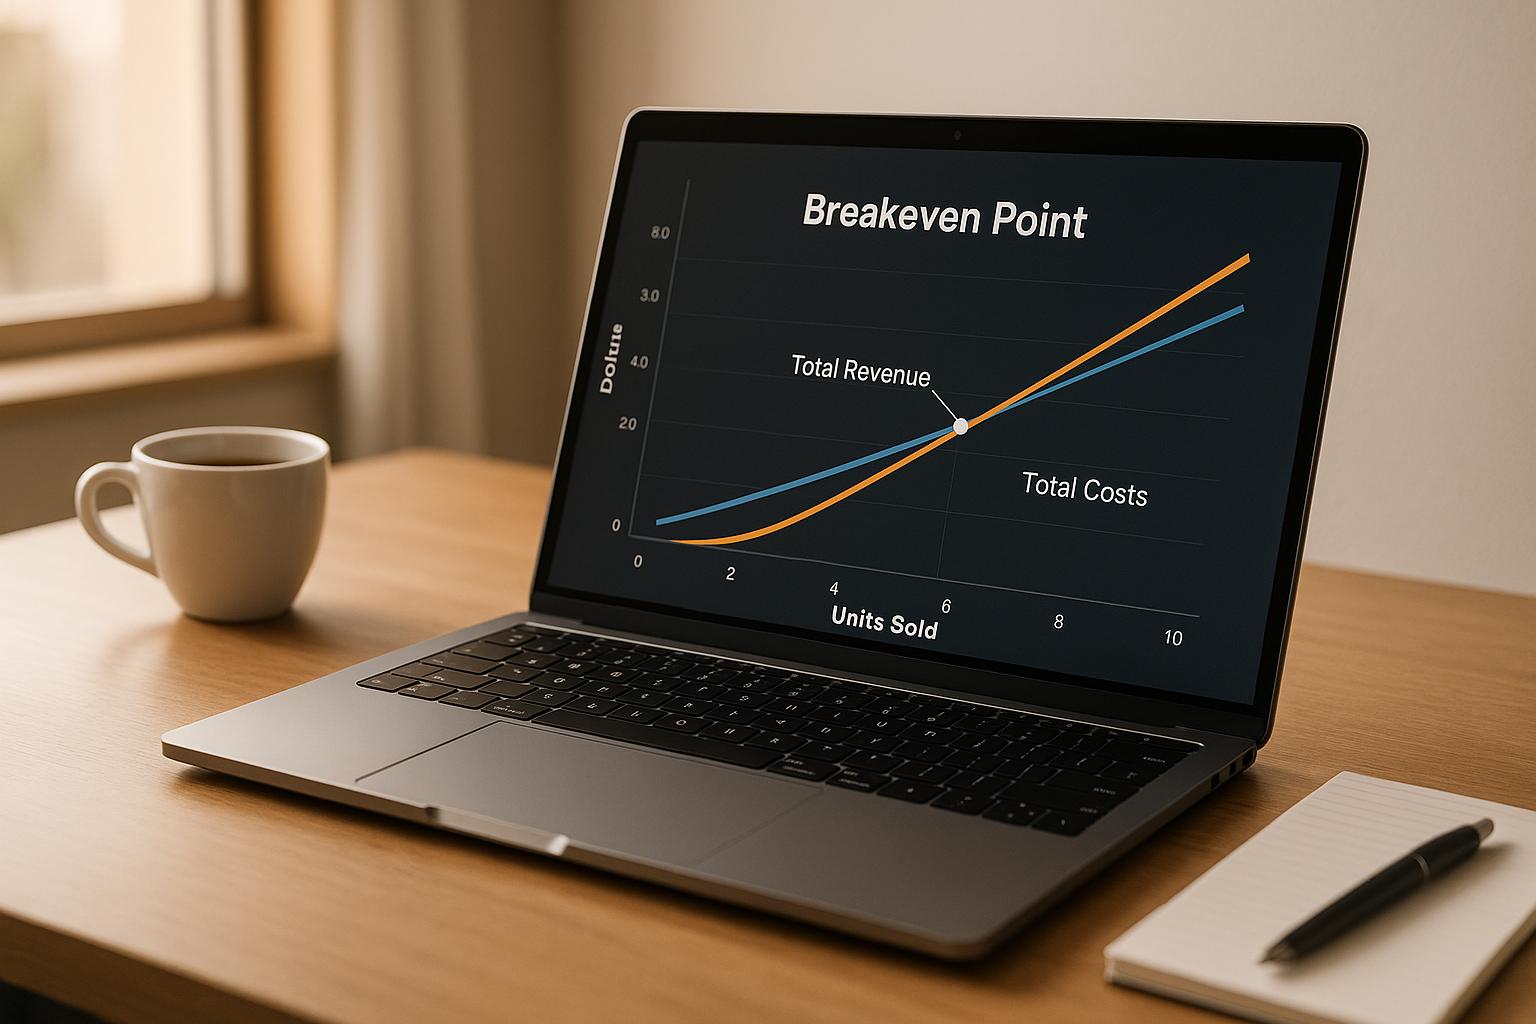
What Is a Breakeven Point and Why It Matters
A breakeven point is reached when your total revenue equals your total costs. Understanding this point is crucial for making informed decisions - it helps you set realistic sales goals, price your products effectively, and avoid relying on guesswork.
Think of breakeven as your financial compass. It guides decisions like launching new products, entering new markets, or making investments by showing exactly how much you need to sell to cover your expenses. For investors and lenders, breakeven projections are a key metric - they use them to estimate when they might see returns on their investments.
"Determining our break-even point removed the guesswork and allowed us to move forward with clarity and set realistic sales targets and efficiently manage resources." - Aleksi Halsas, CEO, Clevenio
On average, most businesses aim to hit their breakeven point within six to 18 months. This timeframe provides a realistic benchmark for planning cash flow, securing funding, and managing resources effectively. Now, let’s break down the formula that helps you calculate your breakeven point.
The Breakeven Formula Explained
The breakeven formula is simple yet powerful:
Fixed Costs ÷ (Unit Price - Variable Cost per Unit) = Breakeven Point in Units
Here’s a real-world example to make it clear:
Rachel's Bakery has $6,200 in monthly fixed costs. These include rent, insurance, staff salaries, equipment leases, and utilities. Rachel sells cakes for $75 each, and her variable costs - covering ingredients, packaging, and credit card fees - come to $23 per cake.
Using the formula:
$6,200 ÷ ($75 - $23) = $6,200 ÷ $52 ≈ 120 cakes per month
This means Rachel needs to sell about 120 cakes each month to cover her costs. Once she exceeds that number, she starts generating profit. This calculation not only gives her a clear target but also helps her evaluate whether her pricing strategy is sustainable.
Problems with Manual Breakeven Analysis
While breakeven analysis is essential, doing it manually can be a headache. Spreadsheets are often time-consuming and prone to errors. Many business owners spend weeks perfecting their models, only to discover mistakes in their formulas or realize they’ve based their calculations on outdated market data.
One major issue? Keeping calculations current. Markets shift quickly - supplier costs rise, customer demand fluctuates, and seasonal trends come into play. Static spreadsheets can’t adapt to these changes automatically. They also struggle with more complex scenarios, like managing multiple products with varying profit margins or accounting for seasonal sales patterns.
"Mastering break-even point analysis is crucial to building a sustainable and profitable business." - Jake Munday, CEO and co-founder of Custom Neon
For businesses operating on tight budgets, errors in breakeven calculations can be disastrous. A simple mistake can lead to underpricing, misjudging funding needs, or setting sales goals that are impossible to achieve.
That’s where automated tools like IdeaFloat come in. These tools take the guesswork out of the process by incorporating real-time market data and handling complex calculations. What might take weeks with a traditional spreadsheet can be completed in moments, ensuring accuracy and saving valuable time.
How IdeaFloat Predicted My Breakeven Point in 15 Days
When I decided to put IdeaFloat's breakeven analysis tool to the test, I wasn't convinced it could deliver accurate predictions in just 15 days. Typically, financial modeling involves weeks of tedious spreadsheet work and constant revisions. But IdeaFloat's AI-driven approach promised speed without compromising accuracy, so I gave it a shot.
Here’s how the process unfolded over those 15 days.
Step 1: Entering Financial Data
The first step was straightforward. I entered my financial data into IdeaFloat's Breakeven Analysis tool, which was specifically designed with U.S. businesses in mind. Instead of wrestling with complex spreadsheets, I simply provided:
- Fixed costs: Recurring monthly expenses like office rent, insurance, software subscriptions, and salaries.
- Variable costs: Costs tied to individual projects, such as materials, payment processing fees, and contractor payments.
- Pricing details: My standard service price, which the tool used to calculate the contribution margin.
To make the analysis even more comprehensive, the platform's Startup Cost Analyzer factored in one-time startup expenses. This gave me a clearer picture of when my business would genuinely break even.
Step 2: AI Analysis and Market Data
Once all the data was in, the AI got to work. It didn’t just crunch numbers - it pulled in real-time market data to refine my assumptions and validate my strategy.
The tool also performed a competitive analysis, helping me fine-tune my cost estimates and positioning. By leveraging live market data through specialized APIs, IdeaFloat ensured that my financial model was based on current economic conditions rather than outdated figures.
Step 3: Final Predictions and Adjustments
Within just a few days, the platform generated an initial breakeven prediction. But it didn’t stop there - it also provided actionable suggestions to improve my strategy. For instance, it recommended pricing adjustments to lower the breakeven threshold.
By day 15, I had a detailed forecast that incorporated market conditions, seasonal trends, and competitive insights. And when I hit my breakeven point exactly as predicted, it was clear the tool had nailed it.
This process was not only faster but also far more insightful than traditional methods. What would have taken me months of trial and error was accomplished in just 15 days. The precision and strategic insights IdeaFloat offered saved me weeks of manual effort and highlighted opportunities I might have otherwise missed.
sbb-itb-08dd11e
IdeaFloat Features That Made the Process Simple
IdeaFloat doesn’t just speed things up - it simplifies complex forecasting tasks that would otherwise take days. Two standout features turned what could have been a drawn-out 15-day process into a smooth and efficient analysis.
Automatic Recalculation Tools
Say goodbye to the tedious task of manually updating spreadsheets. With IdeaFloat, any change - like a $200 rent increase or a 10% drop in service pricing - automatically recalculates key metrics. Fixed costs, breakeven points, and other critical figures adjust instantly, thanks to the Breakeven Analysis tool. This not only saved hours of manual work but also significantly reduced the chances of costly errors creeping into financial models.
Live Market Data Integration
IdeaFloat integrates real-time market data, constantly updating forecasts with the latest economic trends and competitive pricing. This feature proved especially helpful when the tool identified a seasonal demand shift early in the analysis. By blending AI-powered insights with up-to-date market data, the platform ensured that my breakeven predictions were rooted in real-world conditions.
These features create a dynamic forecasting model that eliminates technical headaches and has already earned the trust of over 500 entrepreneurs. They didn’t just make the process faster - they made it smarter, setting the stage for confident and informed business decisions.
Results: How Accurate Were the Predictions
I compared IdeaFloat's 15-day predictions to the actual performance in the months that followed. The results closely mirrored industry patterns, as 57% of CFOs report fewer forecasting errors when using AI tools. Here's a detailed look at how the predictions held up and the additional insights they provided.
Testing Prediction Accuracy
When comparing predictions to actual outcomes, IdeaFloat demonstrated impressive precision:
- Breakeven Point: IdeaFloat forecasted that I would reach my breakeven point on March 15, 2025, requiring $47,200 in revenue. On that date, my actual revenue was $46,890 - just $310 short. With a margin of error under 1%, this was a strong indicator of the platform’s accuracy.
- Quarterly Revenue: By June 2, 2025, the platform predicted monthly revenues of $52,500. Actual revenues came in at $51,780, resulting in a 1.4% variance. This consistency over multiple months reinforced the reliability of its forecasts.
- Seasonal Adjustments: IdeaFloat also excelled at accounting for seasonal trends. It predicted a 15% revenue dip during April, a historically slower month, and my business saw a 14.8% decrease compared to March. This aligns with Gartner's forecast that by 2028, 50% of organizations will use AI to replace labor-intensive, bottom-up forecasting approaches.
Additional Business Insights Beyond Breakeven
IdeaFloat went beyond breakeven calculations, uncovering ways to optimize operations and boost profitability:
- Cost Savings: The platform suggested switching suppliers for packaging materials, estimating monthly savings of $1,200. After making the change in April 2025, I saved $1,150 per month - nearly matching the prediction.
- Pricing Adjustments: Using its pricing analyzer, IdeaFloat recommended a 12% increase in premium service pricing, predicting a $3,400 monthly revenue boost with minimal customer loss. After implementing the change in May 2025, my revenue rose by $3,280, with only a 2% drop in customer numbers - well within acceptable limits.
"IdeaFloat saved us weeks of work by helping us explore demand for new products across different regions and took the guesswork out of finding gaps in the market. A must-have for entrepreneurs looking to scale."
- Nick Sherwing, Founder of woohoPets
- New Market Opportunities: The platform identified an untapped market segment with the potential to generate $8,500 in monthly revenue. By targeting this segment with tailored marketing strategies, I achieved $7,900 in additional monthly revenue by late May 2025.
These insights transformed IdeaFloat from a simple breakeven prediction tool into a robust business intelligence platform, offering ongoing value and actionable strategies for growth.
Conclusion: Fast and Reliable Financial Forecasting for Entrepreneurs
AI-powered forecasting has reshaped the way businesses approach planning, reducing timelines from months to just 15 days. This shift isn't just about speed - it's about empowering entrepreneurs with the insights they need to make smarter, faster decisions.
The numbers speak for themselves: businesses that actively forecast experience 30% faster growth and a 70% survival rate, compared to a 29% failure rate for those who don't. As Michael Burdick, Founder and CSO of Paro, explains:
"Cash flow management is intrinsically tied to forecasting capabilities. If you can forecast accurately, you can manage your cash effectively."
Platforms like IdeaFloat take forecasting further by combining market research, competitive analysis, and financial planning into one cohesive tool. It doesn't just calculate breakeven points - it delivers actionable insights that help entrepreneurs cut costs and boost revenue. With over 500 entrepreneurs already using IdeaFloat to validate their ideas, it's clear that tools like these are becoming indispensable for modern business success.
Accurate forecasting is at the heart of survival and growth. IdeaFloat’s ability to deliver precise insights in just 15 days, paired with its all-in-one suite of tools, makes it a game-changer for entrepreneurs committed to building sustainable, profitable ventures. This rapid turnaround highlights the transformative potential of AI-driven forecasting.
FAQs
How does IdeaFloat use AI and market data to accurately predict when my business will break even?
IdeaFloat uses artificial intelligence and real-time market data to pinpoint your business's breakeven point with accuracy. By examining critical elements like market size, competition, pricing strategies, and operational costs, it creates financial forecasts specifically designed to fit your business model.
The platform’s sophisticated algorithms constantly analyze current market trends, keeping predictions timely and dependable. This empowers entrepreneurs to make smarter decisions, plan effectively, and feel more assured about when their business is likely to become profitable.
What makes IdeaFloat better than traditional spreadsheets for predicting a business's breakeven point?
Using IdeaFloat for breakeven analysis streamlines the process compared to traditional spreadsheets. Its AI-driven system handles large datasets with ease, providing quicker and more precise predictions while reducing the chance of human error. This means you can skip the tedious data entry and calculations, freeing up your time for strategic decisions that actually move the needle.
What sets IdeaFloat apart is its ability to spot patterns and insights that manual analysis might overlook. This leads to more reliable financial forecasts with deeper insights. Plus, its intuitive interface and dependable automation make handling complex tasks a breeze, offering clear, actionable insights to help steer your business in the right direction.
Can IdeaFloat adjust breakeven predictions for seasonal trends and market changes?
Yes, IdeaFloat can fine-tune breakeven predictions by factoring in seasonal trends and market fluctuations. By examining historical data and spotting patterns, it adjusts for shifts in consumer demand during both peak and slower seasons. This approach keeps your financial forecasts aligned with what's happening in the market.
This adaptability plays a key role in effective planning. It helps businesses manage cash flow, streamline inventory, and allocate resources wisely. With IdeaFloat, you can handle demand changes confidently while keeping your financial projections accurate and dependable.
Related posts
- How IdeaFloat's AI Predicted My Business's Profitability Within 2%
- IdeaFloat Turned My Napkin Idea Into a Funded Business in 72 Hours
- IdeaFloat Just Saved Me 40 Hours of Business Planning (Here's How)
- IdeaFloat's Market Analysis Saved Me From a $20,000 Business Mistake