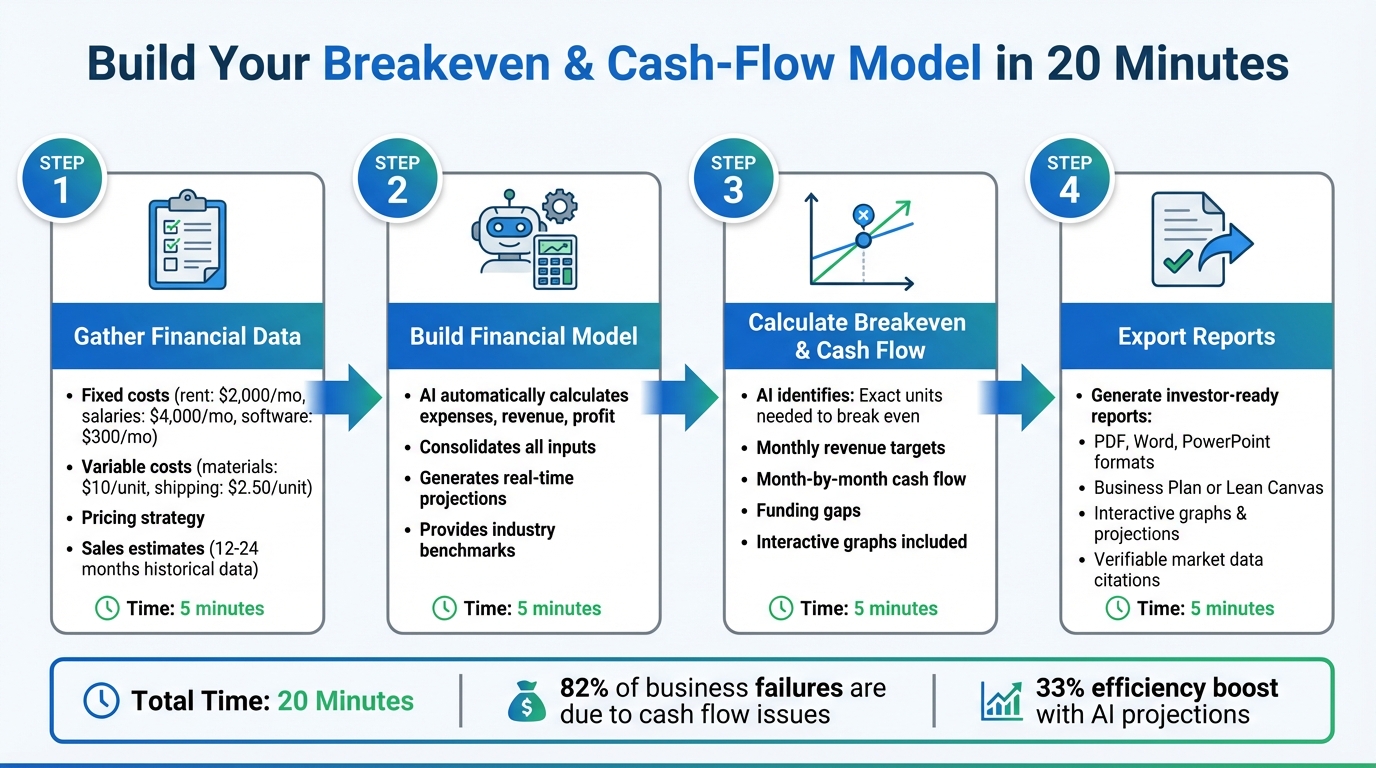
AI tools like IdeaFloat simplify financial modeling, turning a process that once took weeks into a task you can complete in just 20 minutes. By automating calculations, pulling real-time market data, and offering interactive visuals, these tools make it easy to calculate breakeven points, project cash flow, and prepare investor-ready reports - all without advanced finance skills. Here’s how it works:
- Step 1: Gather financial data (fixed costs, variable costs, pricing, and sales estimates).
- Step 2: Use AI to build a financial model, automatically calculating expenses, revenue, and profit.
- Step 3: Identify your breakeven point and track cash flow with interactive graphs.
- Step 4: Export polished reports for investors or internal use.
With AI handling the heavy lifting, small business owners can quickly create accurate financial projections, helping them avoid cash flow issues - the leading cause of 82% of business failures. Ready to try it? Platforms like IdeaFloat make it simple to start.
4-Step AI Financial Modeling Process: From Data to Investor-Ready Reports in 20 Minutes
Excel Agent Mode: Build Financial Models with AI in Minutes (Full Tutorial)
Step 1: Gather Your Financial Data
Start by collecting all the essential financial data you’ll need - missing even a single key figure can throw off your entire financial model. Don’t worry, you don’t need to be a finance expert or have years of records. Focus on the basics: fixed costs, variable costs, pricing, and sales estimates.
If you already have an established business, gather 12–24 months of financial records. These could include accounting software reports, bank statements, or sales data. This historical data is invaluable because it allows AI tools to identify patterns you might overlook, like seasonal sales spikes or changes in customer acquisition costs. If you’re just starting out, rely on well-researched estimates instead. This groundwork sets the stage for building an accurate financial model.
List Your Fixed and Variable Costs
Fixed costs are the recurring expenses that keep your business running, no matter how much you sell. These include things like office rent (e.g., $2,000/month), administrative salaries (e.g., $4,000/month), software subscriptions (e.g., $100–$500/month), insurance, and website hosting fees. Write down all your regular, recurring expenses.
Variable costs, on the other hand, change based on your sales volume. If you sell nothing this month, these costs will be zero. Common examples include raw materials (e.g., $10.00 per unit), packaging and shipping (e.g., $2.50 per unit), transaction fees (usually 2.9% + $0.30 per sale), and direct labor tied to production. It’s important to calculate these costs either on a per-unit basis or as a percentage of each sale.
To make this easier, here’s a simple table to organize your data before inputting it into IdeaFloat:
| Category | What to Include | Example Costs (USD) |
|---|---|---|
| Fixed Costs | Rent, salaries, software, insurance | Rent: $2,000; Software: $300; Salaries: $4,000 |
| Variable Costs | Materials, shipping, packaging, fees | Materials: $10/unit; Shipping: $2.50/unit |
| Cash Inflows | Sales revenue, loans, investments | Product sales, loan receipts, asset sales |
| Cash Outflows | All spending categories | Marketing, taxes, loan repayments |
If your expenses feel scattered, consider using AI tools to sort them. Upload a CSV of your transactions, and AI can automatically group them into “Fixed” and “Variable” categories based on patterns. This saves you hours of manual effort.
Set Your Prices and Sales Estimates
Your pricing strategy doesn’t just cover costs - it also determines your contribution margin (the amount left after subtracting variable costs from the sale price). For instance, if you sell custom t-shirts for $30.00 each and your variable costs (like materials, printing, and shipping) total $15.00, your contribution margin is $15.00. That margin helps cover your fixed costs and, eventually, contributes to your profits.
"The strength of your model depends on the strength of your estimates, so it pays to do your research early on." - Andrew Blackman, Finance Author
When estimating sales, steer clear of vague, top-down projections like “0.1% of a $35 billion market.” Instead, use a bottom-up approach. Break your monthly sales goals into daily targets, and check if these numbers match your production capacity and resources.
AI tools can also provide benchmarks to keep your expectations realistic. For example, AI might show you that coffee shops typically have net margins between 2–15% and operating expenses ranging from 55–85%. Use these industry averages to double-check your assumptions. With your data organized and your estimates in place, you’re ready to start building your AI-powered financial model.
Step 2: Create Your Financial Model
Now that you've gathered your cost and pricing data, it's time to bring it all together using IdeaFloat. This platform’s conversational interface simplifies the process, making it quick and easy to build your financial model. Let’s dive into how you can input your data and watch your numbers come to life.
Enter Your Data into IdeaFloat
Using the data you collected in Step 1, IdeaFloat helps you transform those figures into a dynamic financial model. Start by heading to Phase 3: Can You Actually Make Money? in your IdeaFloat workspace. Here, you’ll work through three tools designed to give you a complete financial picture.
- Cost Analysis Module: Begin by entering your fixed startup costs and monthly operational expenses. These numbers should match the details you’ve already gathered, including both fixed and variable costs.
- Product & Service Creator: Define your products or services and their associated variable costs. You can either manually input your offerings or let the AI suggest a lineup tailored to your business type. This tool will also calculate how many units you need to sell each month to cover costs and turn a profit. If you’re uncertain about pricing, try the Advanced Pricing Research tool. It analyzes competitor pricing and market trends to recommend pricing strategies that maximize profit margins.
"IdeaFloat saved us weeks of work by helping us explore demand for new products across different regions and took the guesswork out of finding gaps in the market." - Nick Sherwing, Founder of woohoPets
Once your costs and product details are entered, IdeaFloat does the heavy lifting. The platform’s Financial Model tool automatically consolidates all your inputs, eliminating the need for manual spreadsheets. It tracks your total sales, expenses, and net profit in real time, giving you a clear picture of your business’s financial health.
Read Your Financial Results
After entering your data, IdeaFloat instantly generates detailed financial projections. These include monthly revenue, expenses, and profit, all broken down into an easy-to-read format. For example, if you’re selling 200 t-shirts at $30 each (bringing in $6,000 in revenue), with $3,000 in variable costs and $6,300 in fixed costs, the model will show a $3,300 monthly loss. This insight lets you know you need to either boost sales, adjust pricing, or cut expenses.
The platform also identifies your funding needs, showing whether you’ll require investors or loans to cover costs until you reach profitability. Interactive graphs highlight your breakeven point and the capital needed to bridge the gap. Best of all, this process takes just 15 minutes - much faster than traditional methods. Anytime you update your inputs, IdeaFloat recalculates projections automatically, keeping your financial model up to date.
sbb-itb-08dd11e
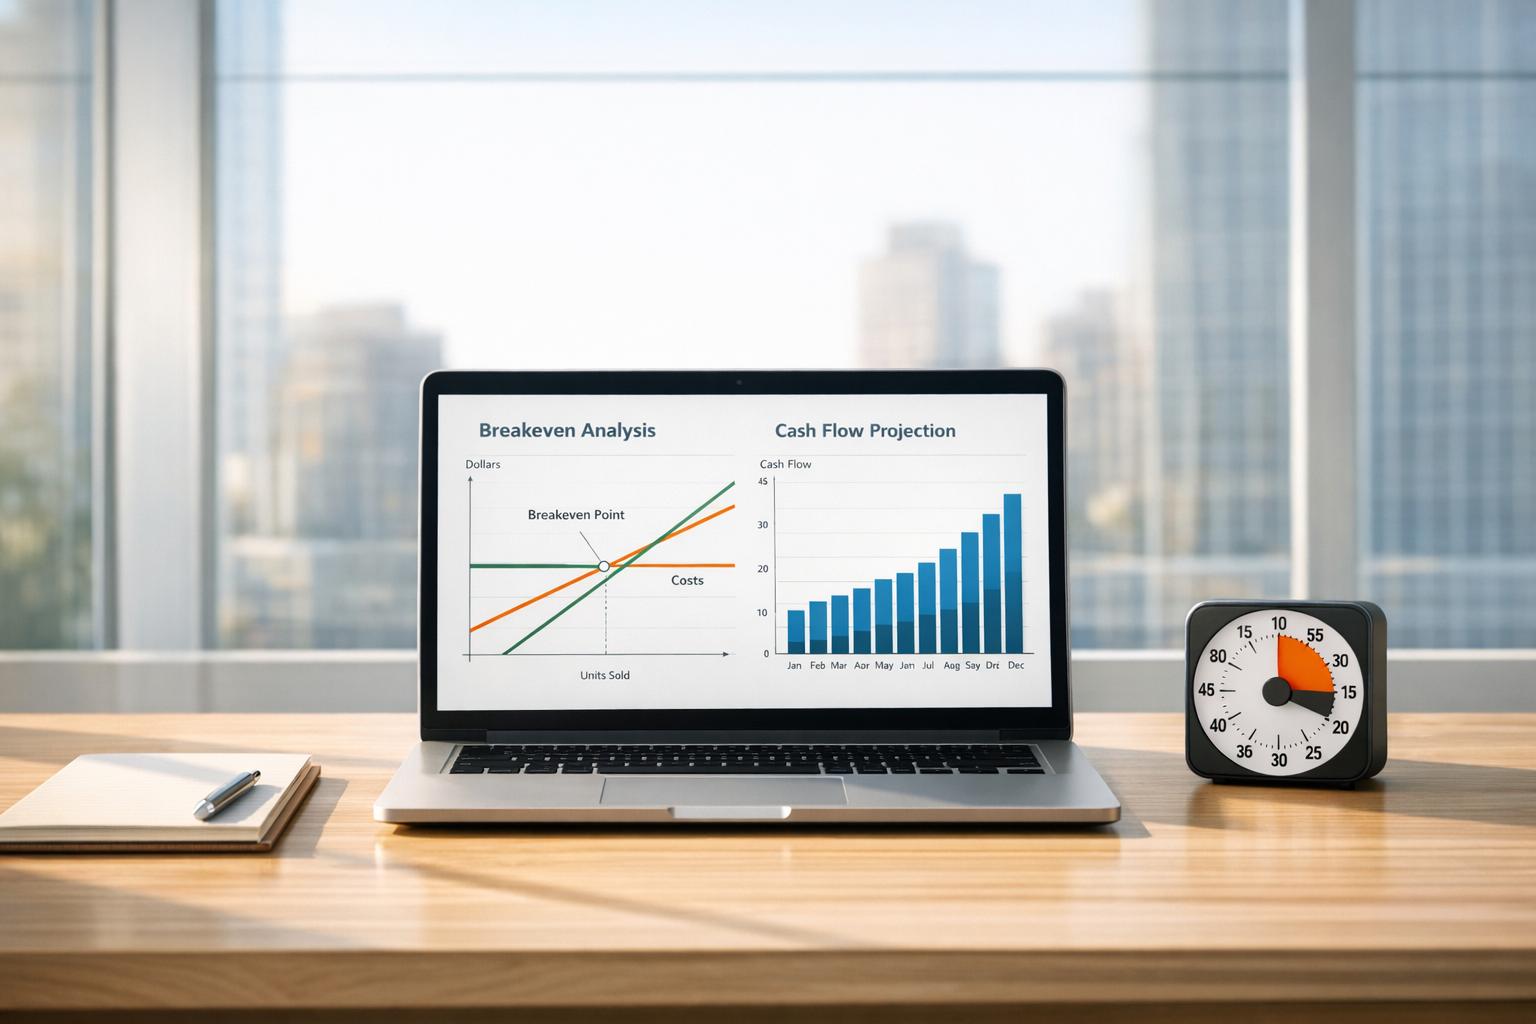
Step 3: Calculate Breakeven and Cash Flow
IdeaFloat takes the guesswork out of financial planning by automatically calculating your breakeven and cash-flow points based on the information you provide. No need to wrestle with spreadsheets or manual formulas - it determines when you'll stop losing money and when you'll start seeing positive cash in your account.
Find Your Breakeven Point
Once your financial model is set up, the next step is figuring out when your revenue will finally cover your costs. IdeaFloat does this by pulling data from your Cost Analysis, Product & Service Creator, and Advanced Pricing Research tools. It calculates the exact number of units you need to sell each month to cover all your expenses - whether it's fixed costs like rent or variable costs like materials.
The platform also provides interactive graphs that make it easy to visualize this. You’ll see exactly where your revenue meets your expenses, pinpointing the moment you stop operating at a loss.
"Figured out my breakeven point and what I could actually charge. No spreadsheet nightmares." - James T., E-commerce Founder
For instance, if you input details such as your product pricing, variable costs, and fixed monthly expenses, IdeaFloat will calculate how many units you need to sell each month to break even. It also shows the revenue required to hit that target, giving you clear monthly sales goals.
View Your Cash-Flow Projections
Beyond just breaking even, IdeaFloat provides month-by-month cash-flow projections, giving you a clear picture of when cash comes in, when it goes out, and what’s left in your account. These projections let you spot potential cash gaps before they become problems. With interactive graphs, you can easily identify periods of negative or positive cash flow, which can guide decisions like whether to bootstrap, apply for SBA funding, or pitch to investors.
Step 4: Review and Export Your Reports
Take a moment to review your data and prepare the final reports for investors, partners, or internal records. With IdeaFloat, this step is streamlined, but a thorough review ensures your numbers are accurate and ready to share.
Analyze Your Financial Data
Before hitting "export", double-check that the numbers align with your business's unique circumstances. While IdeaFloat's Financial Model meticulously tracks every dollar, only you can confirm that external factors - like contract end dates or upcoming product launches - are properly accounted for. Use the interactive graphs to evaluate how seasonal expenses or revenue fluctuations might impact your bottom line.
Check that the Cost Analysis tool has captured all expenses (think website hosting, raw materials, insurance, and the like). Confirm your net cash flow by subtracting your outflows from inflows. If something feels off, the manual override feature allows you to tweak product offerings, service lists, or pricing as needed. Additionally, the Smart Market Sizing section provides reliable market data citations - cross-check these to ensure they're up-to-date and relevant to your industry.
Once you're confident in the accuracy of your data, you're ready to generate and export your final reports.
Export Reports for Investors
IdeaFloat makes exporting simple, offering formats like PDF, Word, and PowerPoint. For formal investor presentations, the Business Plan Generator compiles your financials, visuals, and market insights into a professional document. If you need to provide quick updates to mentors or internal teams, the Lean Canvas delivers a concise, one-page summary that’s easy to share.
Both options include interactive graphs and month-by-month projections formatted in USD, ensuring your breakeven points and cash-flow data are presented in a clear, digestible way. Plus, the platform's market sizing calculations come with verifiable citations - an added layer of credibility that investors value when evaluating funding opportunities.
Conclusion
Main Benefits Summary
Financial modeling used to be a time-consuming task, often requiring months of work and intricate Excel formulas. IdeaFloat changes the game by letting you assess your business idea's financial potential in just 15 to 20 minutes. It replaces the headache of spreadsheets with clear, interactive insights, all backed by live market data and verifiable sources - exactly the kind of information investors want when evaluating funding opportunities.
Freelancers can reclaim up to 8 hours each week, while companies see a 33% boost in efficiency thanks to AI-powered projections. IdeaFloat ensures every dollar is accounted for, helping you confirm whether your business idea is truly viable. The platform’s Cost Analysis and Financial Model tools deliver month-by-month projections in USD, complete with interactive graphs that map out your journey to profitability. With real-time data and streamlined forecasting, you’re equipped to make smarter decisions.
Get Started with IdeaFloat
IdeaFloat empowers you to make confident, well-informed choices about your business. You can explore your idea’s revenue potential without any upfront cost - getting started is free. The platform walks you through each step, from validating your business challenge to calculating your breakeven point and monthly funding needs.
Once your financial model is ready, you can export polished, investor-ready reports in formats like PDF, Word, or PowerPoint. Whether you need a detailed business plan or a concise Lean Canvas for quick updates, IdeaFloat compiles your financial data, visuals, and market insights into professional-grade documents. Ready to take the next step? Head to IdeaFloat.com, click "Float a New Idea", and begin building your breakeven and cash-flow analysis today - no technical skills required.
FAQs
How does IdeaFloat use AI to create accurate financial projections?
IdeaFloat uses AI-driven algorithms to generate financial projections by analyzing customer data, market trends, and historical financial records. This approach ensures the forecasts are grounded in solid data and maintain a high level of reliability.
What sets IdeaFloat apart is its flexibility. Users can input their own business-specific assumptions, enabling the AI to adjust and refine the projections. This blend of automation and customization empowers businesses to make decisions faster and with greater confidence.
What are the main advantages of using AI for financial modeling instead of traditional methods?
Using AI for financial modeling offers clear advantages compared to traditional methods. One standout benefit is the speed and efficiency it brings. AI tools can build and update financial models in just minutes, taking over tasks like data entry, setting up formulas, and running scenario analyses. This not only saves time but also reduces the burden of manual work, cutting down on potential errors.
Another major perk is improved accuracy. AI minimizes typical spreadsheet mistakes, such as broken formulas or mismatched data, ensuring the models are more reliable. On top of that, AI-powered tools simplify collaboration, allowing teams to work on the same model without worrying about version control or conflicting updates.
By using AI, entrepreneurs and finance professionals can quickly test financial feasibility, make decisions with confidence, and dedicate more energy to strategic planning instead of getting bogged down by repetitive calculations.
Can startups without much financial data use IdeaFloat for forecasts?
IdeaFloat is built to support startups, even if they lack extensive financial history. With the help of AI-powered tools, it streamlines the creation of financial forecasts and projections by emphasizing essential business drivers and assumptions.
If you have a basic grasp of your business’s key metrics, IdeaFloat can walk you through crafting accurate breakeven and cash-flow analyses with ease and speed.
Related Blog Posts

Get the newest tips and tricks of starting your business!