Understanding your breakeven point is essential for running a business. It tells you how much you need to sell to cover your costs - nothing more, nothing less. The IdeaFloat Breakeven Calculator simplifies this process, offering quick results in just 15 minutes. Here's what you need to know:
- Breakeven Point: The sales volume where revenue equals costs, meaning no profit or loss.
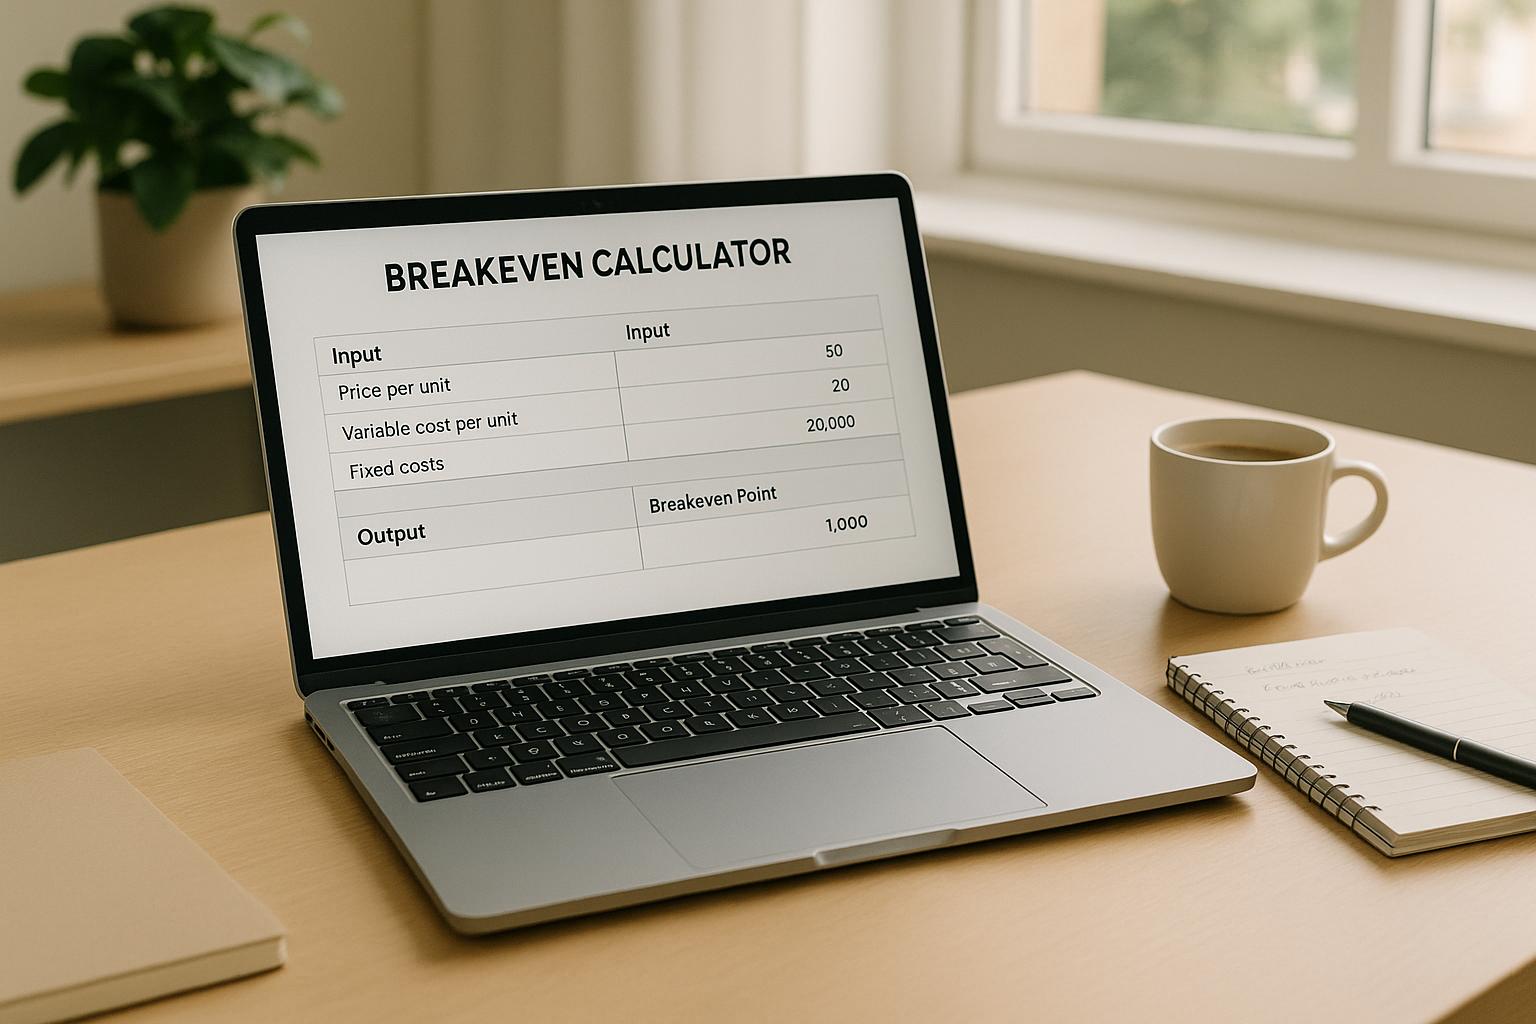
- Formula: Fixed Costs ÷ (Selling Price - Variable Costs per Unit).
- Why It Matters: Helps you set pricing, control costs, and plan for profitability.
- What You'll Need:
- Fixed Costs (e.g., rent, salaries, utilities).
- Variable Costs per Unit (e.g., materials, shipping, hourly labor).
- Selling Price per Unit.
The calculator does the math for you, showing how many units you need to sell and the corresponding revenue target. It also offers insights on adjusting costs or pricing to improve profitability. Whether you're pricing products, planning sales goals, or preparing for growth, this tool provides clarity and saves time.
How to Calculate a Break Even Point (Guide)
Financial Data You Need for Breakeven Calculation
To use the IdeaFloat Breakeven Calculator effectively, you’ll need three key financial data points. Having accurate figures ensures your breakeven analysis reflects your actual business situation. Most entrepreneurs already have this information; the key is organizing it properly.
Make sure to use U.S. currency format (e.g., $7,000.00) for all amounts. Review each cost category carefully to account for all relevant expenses.
Fixed Costs Explained
Fixed costs are the expenses that remain constant each month, no matter how much you sell or produce. These are your baseline operating costs.
Common fixed costs include rent or mortgage payments for your business space, salaries for employees (excluding hourly wages), insurance premiums, loan repayments, software subscriptions, and utilities such as electricity and internet. For instance, if your monthly rent is $2,500.00, salaries total $4,000.00, insurance is $300.00, and utilities are $200.00, your fixed costs add up to $7,000.00 per month.
If you run a home-based business, include the portion of your home expenses used for work. For example, if your home office takes up 20% of your house, you can allocate 20% of your mortgage toward fixed costs.
Other examples of fixed costs are equipment depreciation (e.g., $200.00 per month for a $12,000.00 asset over 60 months) and recurring professional fees. Collecting precise fixed cost data is essential, as it directly impacts the accuracy of your breakeven analysis.
Variable Costs per Unit
Variable costs fluctuate depending on how many products you sell or services you provide. These costs directly affect your profit margins.
For most businesses, raw materials represent the largest portion of variable costs. If you’re making handmade candles, for instance, this includes wax, wicks, fragrance oils, and containers. For service-based businesses like consulting, variable costs might include research tools, travel expenses, or fees for subcontractors.
Don’t overlook shipping and packaging costs, as they can add up quickly. For example, if shipping a product costs $3.50 and packaging materials cost $0.75, your total shipping and packaging expense is $4.25 per unit. Payment processing fees also count - if your payment processor charges 2.9% + $0.30 per transaction, calculate this based on your average sale price.
Hourly labor used in production is another variable cost. Unlike salaried employees, these workers are paid based on output. If you pay $15.00 per hour and it takes 30 minutes to produce one unit, that’s $7.50 in labor costs per unit.
Be thorough when identifying variable costs. Even small expenses like credit card fees ($0.30 per transaction) or packaging tape ($0.05 per package) should be included for accuracy. Enter all these costs into the calculator to see how they influence your breakeven point.
Setting Your Product or Service Price
Once you’ve accounted for fixed and variable costs, the next step is setting the right price. Your price must cover costs while aligning with your market positioning.
Start by researching competitors’ prices. If similar products range from $25.00 to $45.00, you have a pricing range to consider. However, don’t just aim for the middle - factor in your value proposition. If your product offers premium features, better customer service, or faster delivery, you may justify pricing closer to the higher end.
In the U.S., psychological pricing can influence sales. Prices ending in .99 or .95 often perform better than round numbers. For instance, $29.99 might sell better than $30.00, even though the difference is small. For B2B services, round numbers like $500.00 or $1,000.00 often appear more professional.
Also, consider your target profit margin when setting prices. For example, if your variable costs are $12.00 per unit and you aim for a 60% gross margin, your selling price should be $30.00 ($12.00 ÷ 0.40 = $30.00). This ensures you have enough margin to cover fixed costs and earn a profit.
How to Use the Breakeven Calculator in 15 Minutes
Now that you've gathered your cost figures, it's time to determine your breakeven point. The IdeaFloat Breakeven Calculator simplifies what used to be a time-consuming process, allowing you to complete your analysis in just 15 minutes. This tool provides clear financial insights, helping you make smarter choices for your business. Here's how to use it.
Collecting and Entering Your Data
Start by launching the IdeaFloat Breakeven Calculator. You'll find three primary input fields where you'll enter the data you've prepared.
- Enter your total monthly fixed costs. For example, if your fixed costs are $7,000.00, input that amount using the U.S. currency format.
- Add your variable costs per unit. These are the costs associated with producing one unit, such as materials, shipping, packaging, and labor. If your variable costs amount to $19.75 per unit, input that figure in the appropriate field. Ensure all costs are based on the same time period to keep your calculations consistent.
- Input your selling price. This is the price you plan to charge per unit. For instance, if your price is $29.99, whether it's based on psychological pricing or premium positioning, enter that exact number.
Understanding Your Breakeven Results
Once you've entered your data, the calculator instantly provides your results in two key formats:
- Units to Break Even: This figure shows how many products or services you need to sell to cover your costs. Using the example numbers ($7,000.00 fixed costs, $19.75 variable costs, and a $29.99 selling price), the contribution margin per unit is $10.24. This means you'd need to sell about 684 units per month to break even.
- Dollar Sales to Break Even: This converts your unit goal into total revenue. In this case, you'd need approximately $20,516 in monthly sales to reach your breakeven point. The calculator also highlights your contribution margin, which is the amount each sale contributes to covering fixed costs and generating profit. For every unit sold at $29.99, $10.24 goes toward these expenses.
The tool also includes interactive graphs that visually display your fixed costs, variable costs, and total revenue at different sales volumes. These visuals make it easier to spot areas where you can improve or adjust your strategy.
Why This Takes Only 15 Minutes
Traditional breakeven calculations often involve complex spreadsheets and manual data entry, which can be tedious and time-consuming. The IdeaFloat Breakeven Calculator eliminates these hurdles by automating the process. It uses proven financial formulas to deliver instant results, so you can focus on entering accurate data.
Features like smart data validation ensure your inputs are consistent, catching potential errors - like mismatched time periods - before they skew your results. Pre-built templates make it even easier to input data for different business models.
Plus, the calculator integrates seamlessly with other IdeaFloat tools, such as Cost Analysis and Advanced Pricing Research. These integrations allow relevant data to populate automatically, saving you even more time.
Entrepreneurs who use this tool often find they can complete their breakeven analysis quickly, leaving them with extra time to explore scenarios and make informed strategic decisions.
sbb-itb-08dd11e
How to Use Your Breakeven Results
Your breakeven analysis serves as a critical benchmark, helping you set pricing, manage costs, and establish growth goals. With the results from the IdeaFloat Breakeven Calculator, you can transform these figures into actionable strategies for your business. Let’s break down how to use this data effectively.
Understanding Your Results
Your breakeven results reveal the minimum performance your business needs to stay afloat. For example, if the calculator shows you need to sell 684 units or generate $20,516 in monthly sales to break even, that’s your baseline. Falling short means operating at a loss, while exceeding it leads to profit.
The contribution margin plays a big role here. For each sale beyond your breakeven point, the profit grows since only variable costs apply to additional units sold. This makes scaling beyond breakeven a powerful way to improve your financial standing.
Don’t overlook the cash flow implications. If you need $20,516 in sales to break even, you’ll need enough working capital to cover expenses until you hit that target. This is especially important for startups or during slow sales periods.
Once you’ve analyzed these figures, it’s time to explore adjustments that can improve your outcomes.
Adjusting Costs or Pricing to Improve Results
Your breakeven analysis highlights areas where you can make changes to boost profitability. Start by examining fixed costs. For instance, reducing fixed costs from $7,000 to $6,000 lowers your breakeven point to around 586 units - an immediate improvement.
Next, focus on variable costs. Lowering these costs - whether by negotiating better supplier deals, improving efficiency, or using alternative materials - can significantly impact your bottom line. If you reduce variable costs from $19.75 to $18.50 per unit, your contribution margin increases to $11.49, dropping your breakeven to roughly 609 units.
Strategic pricing adjustments can also make a big difference. Raising your price from $29.99 to $32.99 boosts your contribution margin to $13.24, reducing your breakeven to about 529 units. However, you’ll need to account for market demand and competitor pricing before implementing any changes.
Consider using IdeaFloat’s Advanced Pricing Research tool to test different pricing models. It analyzes competitor data and market trends, giving you a clear picture of how price changes could affect your breakeven point.
Another option is bundling products. By offering product bundles that increase the average order value, you can effectively raise your contribution margin without increasing individual product prices. This not only improves your breakeven position but also provides added value to your customers.
Once you’ve optimized pricing and costs, you can focus on building a solid profit plan.
Building Your Profit Plan
Your breakeven analysis provides the foundation for setting realistic sales targets and funding needs. Start by using your breakeven point as the baseline. For example, if breaking even requires selling 684 units monthly and you aim for $5,000 in profit, you’ll need to sell an additional 488 units (since each contributes $10.24), bringing your total target to 1,172 units.
Funding needs also become clearer with this analysis. If you expect to hit breakeven in six months, you’ll need enough capital to cover operating losses during that time, plus additional funds for growth. The IdeaFloat Financial Projections tool can help you model these scenarios with detailed cash flow forecasts.
Your breakeven results also guide market goals. Let’s say your target market has 50,000 potential customers, and you need 684 monthly sales to break even. That’s roughly 1.4% market penetration - a figure you can use to assess the feasibility of your goals based on market size and competition.
Scalability assessment is another key benefit. Knowing that every sale beyond 684 units generates $10.24 in profit helps you evaluate growth opportunities. For example, a $2,000 marketing campaign that drives 250 additional sales would yield $2,560 in profit, making it a worthwhile investment.
Finally, incorporate your breakeven analysis into seasonal planning. Many U.S. businesses face seasonal shifts in demand, so understanding how to maintain profitability during slow periods is crucial. You might need higher margins during peak seasons to offset quieter months.
With IdeaFloat’s Go-to-Market Strategy tool, you can align your breakeven targets with specific customer acquisition strategies. This ensures your marketing efforts are focused on the channels most likely to deliver the sales volume you need to succeed.
How IdeaFloat Helps U.S. Entrepreneurs

IdeaFloat offers a comprehensive platform designed to guide U.S. entrepreneurs from the initial idea to a successful product launch. By combining financial modeling, market validation, and launch tools, it provides the resources needed to make informed decisions and build a strong foundation for your business. These tools work hand-in-hand with your breakeven analysis, giving you the clarity and confidence to move forward.
AI-Powered Financial Modeling
With IdeaFloat's Financial Projections & Breakeven Analysis tool, you can create detailed monthly financial forecasts that map out your journey to profitability. It simplifies the process by organizing costs and revenue projections, making it easier to understand your financial outlook. The Cost Analysis feature further breaks down operating expenses, helping you prepare for early funding discussions with clear, actionable data.
Live Market Validation
Understanding your market is key to setting the right price and targeting the right audience. IdeaFloat's Smart Market Sizing tool uses up-to-date market data to estimate the potential size of your opportunity. The Consumer Insights feature taps into online conversations to gauge customer sentiment, while Advanced Pricing Research analyzes competitor pricing to refine your strategy. Additionally, the Go-to-Market Strategy tool estimates customer acquisition costs, ensuring your marketing aligns with your financial goals. These real-time insights go beyond numbers, helping you craft a business strategy that’s both practical and effective.
Faster Business Launches
IdeaFloat's launch tools are designed to get your business off the ground quickly. You can generate early interest with a waitlist landing page and connect with your target market through dedicated online communities. The Launch Checklist keeps you on track, while the Business Plan Generator helps you create a professional, investor-ready presentation. With a free tier and discounted annual plans, these tools are accessible even for entrepreneurs working with limited budgets.
Start Making Better Business Decisions Today
Knowing your breakeven point is a game-changer when it comes to moving forward with your business idea. It tells you exactly how many units you need to sell to cover your costs, giving you the power to make smarter decisions about pricing, marketing budgets, and growth strategies. No more guessing - just clear, actionable insights to help you plan effectively.
The IdeaFloat breakeven calculator makes this process simple. In just 15 minutes, you can turn what feels like complicated financial analysis into something straightforward. You don’t need an MBA - just plug in your fixed costs, variable costs per unit, and selling price, and you’ll see a clear path to profitability.
This analysis becomes the backbone of your strategic planning. Whether you’re setting sales targets, deciding on inventory investments, or preparing for investor meetings, you’ll replace uncertainty with data that drives better decisions.
But why stop there? Using the full IdeaFloat platform takes your strategy to the next level. Your breakeven analysis is just the beginning of a bigger, more data-driven approach. When paired with the platform’s validation tools, you can fine-tune your pricing, refine your market strategy, and create more accurate financial forecasts. Over 1,000 entrepreneurs have already used IdeaFloat to turn their ideas into thriving businesses, starting with one simple question: can this idea actually make money?
Don’t leave your decisions to chance. Use real data to guide your next move. Try the IdeaFloat breakeven calculator today and find out what it takes to reach profitability. Whether it’s tweaking your pricing, adjusting costs, or gearing up for launch, you’ll have the clarity and confidence to take the next step.
FAQs
How do I identify my fixed and variable costs to get accurate results from the breakeven calculator?
To use a breakeven calculator effectively, you need to accurately separate your fixed costs from your variable costs. Fixed costs are steady expenses that remain unchanged regardless of your sales or production levels. Think of things like rent, employee salaries, or insurance. On the flip side, variable costs shift based on how much you produce or sell - examples include materials, shipping fees, or sales commissions.
Go through your financial records carefully and categorize these expenses. Doing so ensures the calculator gives you a dependable breakeven point, which can guide better business decisions.
What should I watch out for when using a breakeven calculator for my business?
When working with a breakeven calculator, there are a few common missteps you’ll want to avoid to ensure accurate results. First, it’s crucial to correctly separate fixed costs - expenses like rent or salaries that don’t change with production levels - from variable costs, such as materials or production-related expenses. Mixing these up can throw off your calculations.
Another frequent error is assuming your contribution margin - the gap between your sales price and variable costs - will stay the same. Market shifts, discounts, or fluctuations in material costs can easily change this margin, so it’s important to account for potential variability. Also, don’t forget about hidden costs like maintenance, taxes, or unexpected fees. These overlooked expenses can significantly affect your breakeven analysis.
Lastly, be realistic with your sales projections. Overestimating sales can lead to overly optimistic conclusions, while underestimating them might result in needlessly cautious decisions. Taking the time to input accurate and well-researched figures will make your breakeven calculator a much more reliable tool for planning and decision-making.
How can I use breakeven analysis to make smarter decisions about pricing and managing costs?
Breakeven analysis is a powerful tool for understanding what it takes to cover your costs. It helps you determine the exact sales volume needed to avoid losses. Armed with this insight, you can set practical sales targets, refine your pricing strategies, and pinpoint areas to cut fixed or variable costs.
For instance, if your breakeven point seems out of reach, you might consider trimming expenses or adjusting prices - carefully, so you remain competitive. This analysis also serves as a roadmap for growth, showing how shifts in costs or pricing can influence your bottom line.
Related Blog Posts

Get the newest tips and tricks of starting your business!