Is your market big enough to succeed? Before launching a product or pitching to investors, understanding your market size is crucial. This involves calculating three key metrics:
- TAM (Total Addressable Market): The total revenue opportunity if you captured 100% of the market. Example: 500,000 customers × $200/year = $100M.
- SAM (Serviceable Available Market): A realistic portion of TAM you can serve based on your business model. Example: TAM × 15% (geography or niche focus) = $15M.
- SOM (Serviceable Obtainable Market): The achievable share of SAM in 3–5 years, factoring in resources and competition. Example: SAM × 2% = $300,000.
Accurate market sizing helps you align business goals, financial plans, and go-to-market strategies. Overestimating SOM or relying on outdated data can hurt credibility. Use tools like AI-powered calculators to refine estimates and make informed decisions. TAM, SAM, and SOM are not just investor metrics - they’re the foundation for sustainable growth.
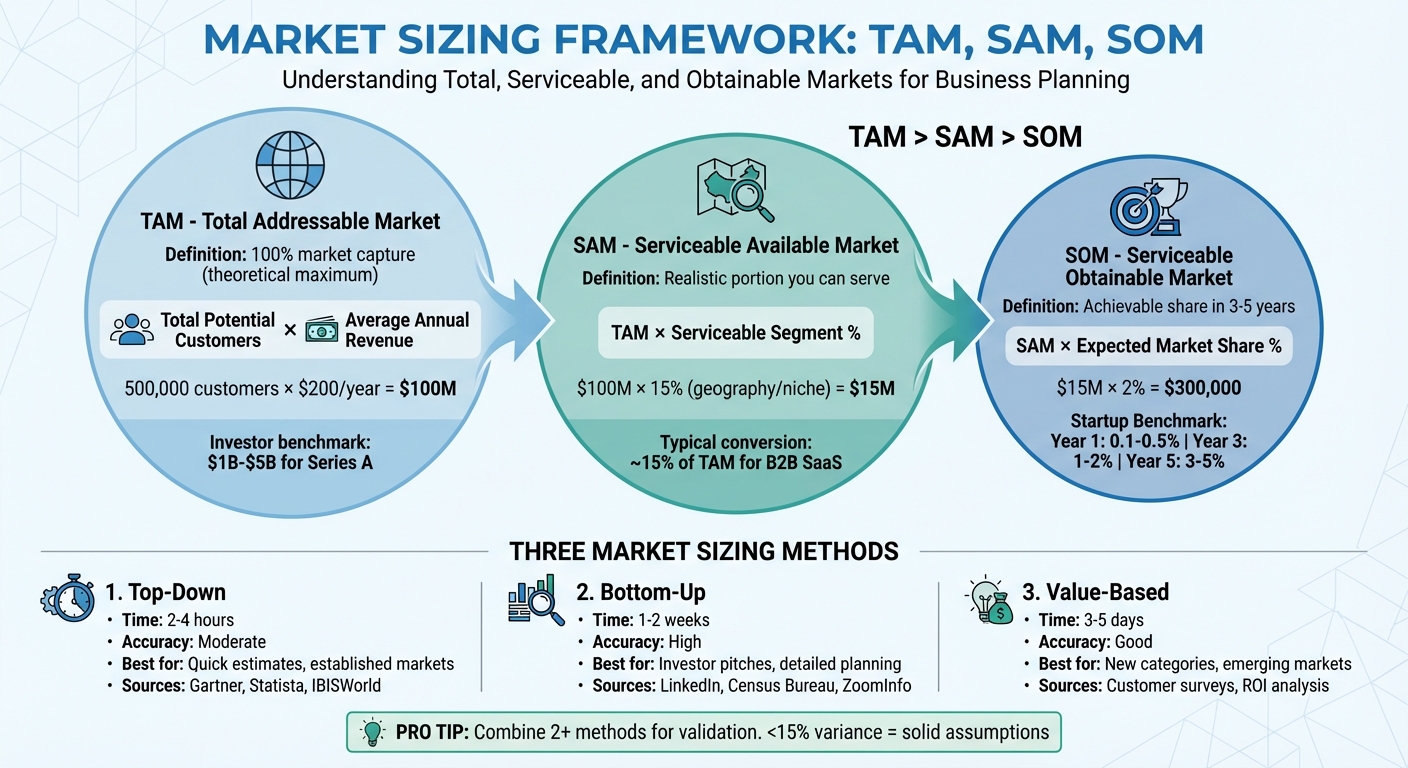
TAM SAM SOM Market Sizing Framework: From Total Market to Obtainable Share
The RIGHT Way to Calculate your Market Size (TAM/SAM/SOM)
sbb-itb-08dd11e
TAM, SAM, and SOM Explained
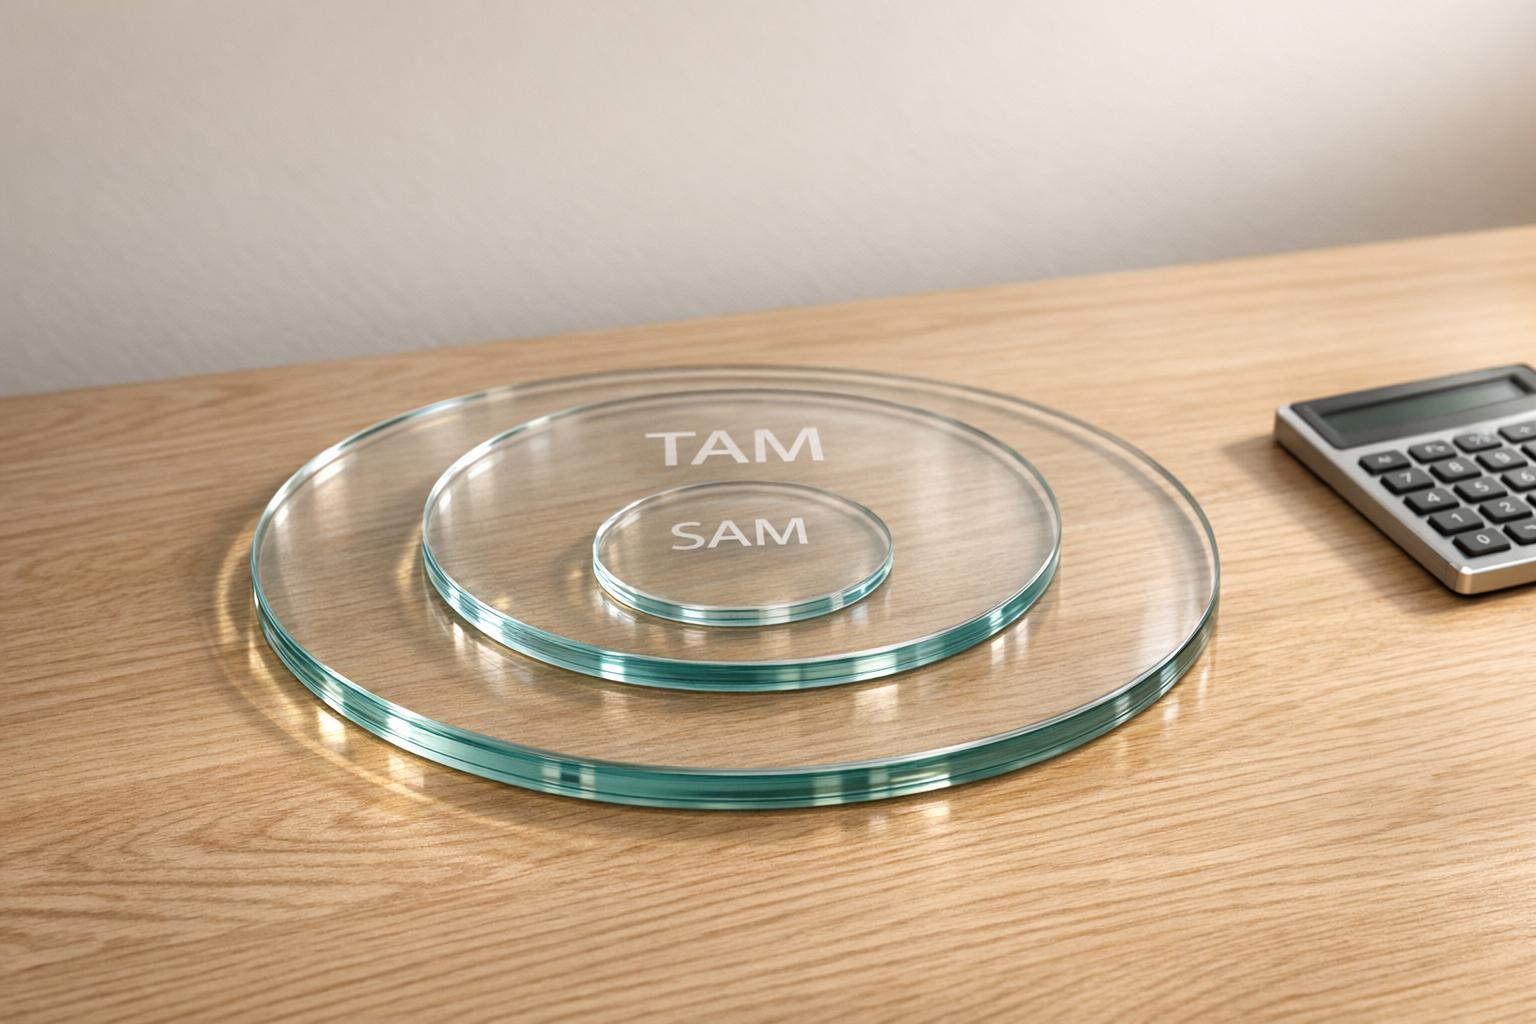
Picture these three metrics as a set of concentric circles, starting broad and narrowing down to what’s actually achievable. In short: TAM > SAM > SOM.
Total Addressable Market (TAM)
TAM represents the biggest possible revenue opportunity - what you’d make if you captured 100% of the global market without any barriers. It’s calculated by multiplying the total number of potential customers by the average annual revenue per customer. For example, if there are 500,000 potential customers worldwide, each paying $200 annually, your TAM would be $100,000,000.
This metric is crucial for investors, as it shows whether your business has enough room to grow. For Series A funding, investors typically look for a TAM between $1 billion and $5 billion.
Serviceable Available Market (SAM)
SAM is a more focused slice of TAM - it’s the part you can realistically target based on your current business model. Factors like geography, language, regulations, and industry specifics narrow this down. For instance, if your product only serves North America (which usually accounts for 40–45% of the global tech market), your SAM would reflect that portion. Similarly, technical requirements or niche use cases could reduce your addressable market even further.
The formula here is straightforward: SAM = TAM × accessible market percentage. This step helps you define your strategic focus and develop an Ideal Customer Profile.
Serviceable Obtainable Market (SOM)
SOM is the most realistic estimate - the share of SAM you’re likely to capture over the next three to five years. It takes into account your sales capacity, marketing budget, and the level of competition. You can calculate SOM by multiplying SAM by your expected market share or by estimating the number of deals you expect to close and their average value.
For startups, SOM is often around 3–5% of SAM within the first few years. If your revenue projections exceed this range, it might be a sign to revisit your business assumptions. A solid SOM estimate is key for aligning your sales and marketing strategies.
| Metric | Definition | Basic Formula |
|---|---|---|
| TAM | Total revenue opportunity with 100% market share | Total Potential Customers × Average Annual Revenue |
| SAM | Portion of TAM reachable with the current business model | TAM × Serviceable Segment % |
| SOM | Realistic share capturable in 3–5 years | SAM × Expected Market Share % |
These metrics provide a clear framework to analyze your market potential. Once you’ve defined them, you can use our AI-powered calculator to get precise estimates tailored to your business.
How to Choose Your Market Sizing Method
Selecting the right market sizing method depends on your data availability and specific goals. These methods form the backbone of the calculator's framework, ensuring your market sizing remains solid and reliable. The most reliable approach combines at least two methods to cross-check results. If your top-down and bottom-up estimates vary by less than 15%, your assumptions are likely well-grounded.
Top-Down Market Sizing
This approach starts with broad industry data from sources like Gartner, Forrester, or IBISWorld, and then narrows it down using filters such as geography, company size, or industry segments. For example, you might begin with a global TAM estimate and refine it to focus on a specific region or sector.
Best for: Early-stage pitch decks where you need a quick, high-level overview. The accuracy is rated as "moderate" and works best in established markets with reliable data.
Bottom-Up Market Sizing
This method involves calculating the number of potential customers and multiplying that by your average revenue per customer. For instance, if you're targeting mid-sized tech companies with HR software, tools like LinkedIn Sales Navigator or Census Bureau data can help you identify how many companies fit your criteria. Multiply that number by your annual contract value to get your estimate. This method is highly accurate.
Best for: Investor presentations, SAM and SOM calculations, and go-to-market strategies. Venture capitalists favor this approach because it shows a clear grasp of your target customers and sales potential.
Value-Based Market Sizing
Here, you estimate market value by quantifying the benefits your product delivers, such as cost savings, revenue increases, or efficiency gains. For example, if your software saves finance teams 20 hours a month at $50/hour, that’s $1,000 in monthly value. Customers might pay about 20% of that value, or $200 per month.
Best for: New market categories where historical data is scarce. For example, Uber in 2010 used this method by combining data on the U.S. taxi market ($11 billion) and black car services ($8 billion), along with partial car ownership substitution, to estimate a $30–$50 billion TAM.
| Method | Time Required | Accuracy | Best Use Case | Key Data Sources |
|---|---|---|---|---|
| Top-Down | 2–4 hours | Moderate | Quick macro-level estimates for established markets | Gartner, Statista, IBISWorld |
| Bottom-Up | 1–2 weeks | High | Detailed investor pitches and sales planning | LinkedIn Sales Navigator, Census Bureau, ZoomInfo |
| Value-Based | 3–5 days | Good | Emerging categories without historical data | Customer surveys, ROI analysis |
For the strongest results, begin with a top-down analysis to set the context, then cross-validate with bottom-up calculations using actual customer data and unit economics. This combination not only strengthens your estimates but also highlights your strategic approach. Once you've established a robust foundation, input your data into the TAM-to-SAM-to-SOM calculator for a more precise market analysis.
How to Use the TAM to SAM to SOM Calculator
IdeaFloat's Smart Market Sizing tool simplifies the process of market calculations by using search engine data and AI-driven keyword analysis. It delivers accurate market estimates with verifiable sources in just minutes. The tool works through a step-by-step funnel: starting with the largest market opportunity (TAM), narrowing it down to your reachable market (SAM), and finally estimating what you can realistically capture in the short term (SOM).
Gather Your Input Data
Before diving into the calculator, gather three key data points:
- Potential customer count: The total number of customers or businesses that fit your Ideal Customer Profile.
- Average Revenue Per Customer (ARPC): For SaaS businesses, this is typically your Annual Contract Value (ACV). For other models, it’s the average annual spend per customer.
- Segmentation filters: Identify relevant factors like geography, industry, company size (based on employee count), and any technical needs such as software compatibility.
Make sure your data is recent - no older than 12–24 months - since outdated information could raise concerns with investors. Always document the source, year, and Compound Annual Growth Rate (CAGR) for every data point to ensure credibility.
Calculate TAM
Once you’ve gathered your data, input it into the calculator to find your Total Addressable Market (TAM). Enter the total potential customer count and average revenue per customer, and the tool will automatically compute your TAM.
For example, if you’re launching HR software and identify 50,000 mid-sized tech companies in the U.S., each with an average annual contract value of $12,000, your TAM would be $600 million. The result is displayed in USD with proper formatting, making it easy to interpret.
Keep in mind that venture capitalists often look for a TAM exceeding $1 billion for scalable investments. If your TAM falls short, revisit your customer profile or pricing strategy.
Filter TAM to Get SAM
Next, refine your TAM to calculate your Serviceable Available Market (SAM). Use filters to exclude areas or segments you cannot currently serve due to product limitations, geographic constraints, or lack of established distribution channels. IdeaFloat’s tool applies percentage-based filters, such as geography or pricing, to help narrow down your TAM.
For instance, if your $600 million TAM includes global tech companies but you’re only targeting the Northeast U.S., apply a geographic filter. If that region accounts for 15% of your total market, your SAM would be $90 million. For B2B SaaS companies, the typical conversion rate from TAM to SAM is around 15%.
Adjust SAM to Estimate SOM
Finally, estimate your Serviceable Obtainable Market (SOM) by applying realistic market share assumptions. This step should align with your sales capacity, including team size, budget, and projected deal flow.
The calculator allows for three scenarios: conservative (0.1–0.5%), base (1–2%), and aggressive (3–5%) market share assumptions. For example, if your $90 million SAM uses a conservative 2% capture rate for Year 3, your SOM would be $1.8 million - a reasonable figure for early-stage pitches.
However, claiming more than 10% of any market can raise red flags with investors unless you’re aiming for long-term dominance. If your market includes well-funded competitors, even capturing 3–5% can be a significant achievement.
Read and Verify Your Results
The calculator provides your TAM, SAM, and SOM values in USD, formatted for easy readability (e.g., $90,000,000.00). Each result is linked to its data source, ensuring transparency for investor presentations.
To ensure accuracy, compare top-down estimates with bottom-up calculations. If there’s a large discrepancy, revisit your assumptions about customer count, pricing, or filters. Testing your SOM with small campaigns targeting a sample segment of your SAM can further validate your projections.
Keep these figures updated quarterly or whenever major market changes occur. Verified and up-to-date numbers are critical for aligning your business strategy with the current market landscape.
How to Use Your Market Size Data
Once you've calculated your TAM (Total Addressable Market), SAM (Serviceable Addressable Market), and SOM (Serviceable Obtainable Market) using the AI-powered calculator, these numbers become the backbone of your strategic planning. They directly impact decisions around pricing, hiring, and customer acquisition strategies.
Compare Market Size to Your Business Goals
If your SOM doesn't align with your $2 million revenue target, it's time to rethink your pricing, market focus, or timeline.
"If your SOM is small relative to your budget, you'll know you need to refine your positioning or go-to-market." - Founder FAQs
For instance, if your revenue target requires 200 customers but your SOM only supports 150, you're overestimating your potential. Most startups capture a modest market share in their early years - typically 0.1% to 0.5% in Year 1, 1% to 2% by Year 3, and 3% to 5% by Year 5. If your projections assume grabbing 10% of the market by Year 2, investors will likely flag this as unrealistic.
If your TAM falls short of what venture capitalists look for, you may need to broaden your market definition, tweak your product offering, or even reconsider seeking venture funding altogether.
Connect Market Sizes to Pricing and Financial Models
Your TAM, SAM, and SOM aren't just numbers - they should directly shape your pricing strategy and financial plans. Tools like IdeaFloat's Advanced Pricing Research and Financial Model can help align your pricing with both market dynamics and business goals.
Start by working backward from your revenue target to calculate the leads you'll need. For example, if your goal is $1.8 million in revenue and your Average Contract Value (ACV) is $12,000, you’d need to close 150 deals. With a typical B2B SaaS SQL-to-Closed-Won conversion rate of 5% to 10%, that translates to 1,500 to 3,000 qualified leads. If your SOM can't support that level of deal flow, your financial plan may need adjusting.
To refine your strategy, run a sensitivity analysis. Create conservative, base, and aggressive projections by adjusting your market share assumptions by ±20%. For instance, if your base SOM assumes a 2% market capture rate, test it at 1.6% and 2.4% to see how these scenarios impact your bottom line.
Market size also influences pricing strategies. A large market might allow for a low-cost, high-volume approach, while a smaller, niche market could justify premium pricing. For instance, if your SAM is $90 million but concentrated in a specialized industry, you might charge more due to the unique problem you’re solving.
With your pricing and projections in place, the next step is to map out a go-to-market strategy.
Use SOM for Go-to-Market Planning
Your SOM provides a realistic foundation for setting customer acquisition goals, planning sales hires, and allocating marketing budgets. It helps you estimate how many customers you can reasonably target and ensures your go-to-market plan aligns with your operational capabilities.
Take Slack as an example. They initially defined their TAM as $9.4 billion, based on enterprise collaboration software data. Narrowing this down, they calculated a SAM of $1.5 billion, focusing on 15 million tech knowledge workers with a $100 ARPU. Their SOM for Year 5 was $50 million, representing a 3.3% market share. This disciplined approach helped Slack raise $120 million at a $1.1 billion valuation and exceed their projections, reaching over $200 million in ARR by Year 5.
To calculate your sales team size, divide your SOM target by the annual quota per salesperson. For instance, if your Year 3 SOM is $1.8 million and each Account Executive is expected to close $300,000 annually, you’d need six salespeople. Tools like IdeaFloat’s Go-to-Market Strategy can further refine your acquisition costs, identify customer channels, and build launch plans, complete with outreach scripts.
Test your SOM assumptions with small campaigns before scaling up. For instance, spend $5,000 to $10,000 over 60 days on targeted outbound and digital ads to gauge demand. If results are promising, scale up to a lightweight launch with a budget of $50,000 to $100,000 over six months to secure your first 5–10 customers. Keep in mind that about 70% of international market entries fail within the first two years due to overestimating demand and stretching resources too thin.
Finally, use your SOM to set tiered Objectives and Key Results (OKRs). For example, aim to capture 0.1% of your SAM in Year 1, scaling to 1% to 2% by Year 3. Revisit your market sizing every 6 to 12 months to adjust for changes in customer counts, Average Revenue Per Customer (ARPC), and competitive landscape.
Common Market Sizing Mistakes to Avoid
Even with the best tools, market sizing can go off track if your assumptions are flawed. Here are some common mistakes entrepreneurs make - and tips to steer clear of them.
Don't Confuse Population with Revenue
Counting potential customers without factoring in revenue per customer is a common misstep. To estimate market size accurately, you need to multiply the number of potential customers by what each would realistically spend - typically referred to as Average Contract Value (ACV) or Average Revenue Per Customer (ARPC).
Another trap is falling for the "just 1%" fallacy. You might hear someone say, "If we can just capture 1% of this massive market, we'll succeed." This thinking overlooks the steep costs of acquiring customers and the difficulty of penetrating even a small slice of a large market. For instance, a $50 million niche where you dominate 30% of the market can be far more lucrative than a $5 billion market where you manage to grab only 0.1%.
Lastly, consistency in your calculations is key - especially when it comes to units and time periods.
Keep Units and Time Periods Consistent
Mixing monthly and annual revenue figures is an easy way to introduce major errors - like accidentally inflating numbers by a factor of 12. To avoid this, always use annual revenue figures and stick to a single currency throughout your calculations.
Be clear about your time horizon as well. For example, Serviceable Obtainable Market (SOM) typically reflects what you can realistically capture within 1–3 years, while Total Addressable Market (TAM) represents a longer-term, theoretical ceiling. If your Year 1 revenue forecast exceeds your calculated SOM, it’s a sign that your pricing or market reach assumptions need a second look.
"Using 2019 data in 2025 makes your analysis worthless." - PMToolkit.ai
Make sure your data is up-to-date. Relying on industry reports older than two years can make your analysis irrelevant. And while accuracy is critical, it’s just as important to avoid overly ambitious SOM estimates that could undermine your credibility.
Don't Overestimate SOM
Your SOM should be grounded in real-world constraints like your sales team’s capacity, lead management ability, and historical conversion rates - not arbitrary percentages. For startups, first-year market share often ranges between 0.1% and 0.3% of the Serviceable Available Market (SAM), growing to 2%–5% by Year 5. Even exceptional companies rarely exceed 10% market share within five years.
To calculate SOM, work from the bottom up. For example, if each sales representative can close $300,000 annually and you plan to hire three reps in Year 1, your realistic SOM would be $900,000 - not the $5 million you might hope for. It’s worth noting that more than 20% of small businesses fail in their first year, often because they overestimate revenue while underestimating operational limits.
"If your TAM fits neatly on a slide but cannot withstand basic operational questions, the issue is not the market. It is the model." - Zenit Data
The takeaway? Build your SOM based on what you can realistically achieve, not on what sounds impressive in a pitch. Grounding your estimates in operational realities will make your model far more credible.
Conclusion
Market sizing isn't about making educated guesses - it's about creating a solid foundation for smart business decisions. Calculating TAM, SAM, and SOM helps you evaluate whether your idea has real potential, estimate the capital you'll need, and pinpoint the customer segments worth targeting. These calculations turn assumptions into solid projections, shaping everything from hiring plans to pricing strategies and go-to-market approaches.
Traditional market research often takes weeks and can be expensive. AI-powered tools like IdeaFloat simplify the process by automating top-down analysis with real-time search data and consumer behavior insights. This platform provides custom market research at a fraction of the usual cost. It identifies search phrases real customers use, estimates online market size, and creates sales projections - all while delivering a detailed go-to-market plan. These tools make it easier to set realistic market expectations based on actionable insights.
The numbers are crucial - they keep your plans grounded. For instance, a $10 million SOM might suggest adopting a lean startup strategy, while a $1 billion SOM could justify scaling aggressively with larger teams and budgets. Investors also use these benchmarks to gauge potential. Seed-stage companies are typically expected to show $1 million to $10 million in SOM potential within three years, while Series A companies often aim for $10 million to $50 million within five years. These thresholds help separate feasible business plans from overly ambitious ones.
With IdeaFloat's Smart Market Sizing tool, you can calculate TAM, SAM, and SOM using data that's easy for investors to verify. These insights will help you set practical goals, allocate resources effectively, and create a business model that can thrive. In the end, the difference between founders who succeed and those who falter often comes down to one critical factor: understanding the true size and scope of their market.
FAQs
How do I pick realistic SAM and SOM percentages?
To determine realistic SAM (Serviceable Addressable Market) and SOM (Serviceable Obtainable Market) percentages, rely on data-driven estimates that align with your target market and your business’s actual capabilities.
SAM refers to the segment of the Total Addressable Market (TAM) that your business can realistically serve, factoring in considerations like geography, customer demographics, and how well your product fits the market. SOM, on the other hand, is the short-term portion of SAM you can realistically capture - often around 1-5% for early-stage startups.
It's important to validate your assumptions using both top-down and bottom-up approaches. This helps ensure your projections are grounded in reality and not overly optimistic.
What data sources should I use for customer counts and pricing?
For understanding customer counts, consider leveraging customer data platforms (CDPs) and market research tools. These tools pull data from various sources to create detailed and reliable customer profiles and segments, making it easier to get a clear picture of your audience.
When it comes to pricing, industry reports, vendor websites, and market research summaries are your go-to resources. For example, typical CDP costs can range from $2,000 to over $5,000 per month for small to mid-sized companies. Larger enterprises, naturally, may face higher expenses. To ensure your pricing aligns with your business needs, use market sizing tools to match costs to your market size.
How often should I update my TAM, SAM, and SOM?
To keep your market estimates accurate, it’s important to update your TAM (Total Addressable Market), SAM (Serviceable Available Market), and SOM (Serviceable Obtainable Market) regularly. Many experts suggest doing this at least once a year or whenever there are major shifts - like market changes, product updates, or the availability of new data. These updates ensure your estimates stay relevant, especially for investor presentations and strategic planning, enabling you to make smarter, more informed decisions.
Related Blog Posts

Get the newest tips and tricks of starting your business!