If I want to size a local service market, I start with my service area, not a national report. The short version is simple: I count the homes or businesses I can serve, estimate how often they buy, multiply by average job value, then narrow that number into TAM, SAM, and SOM.
Here’s the full idea in plain English:
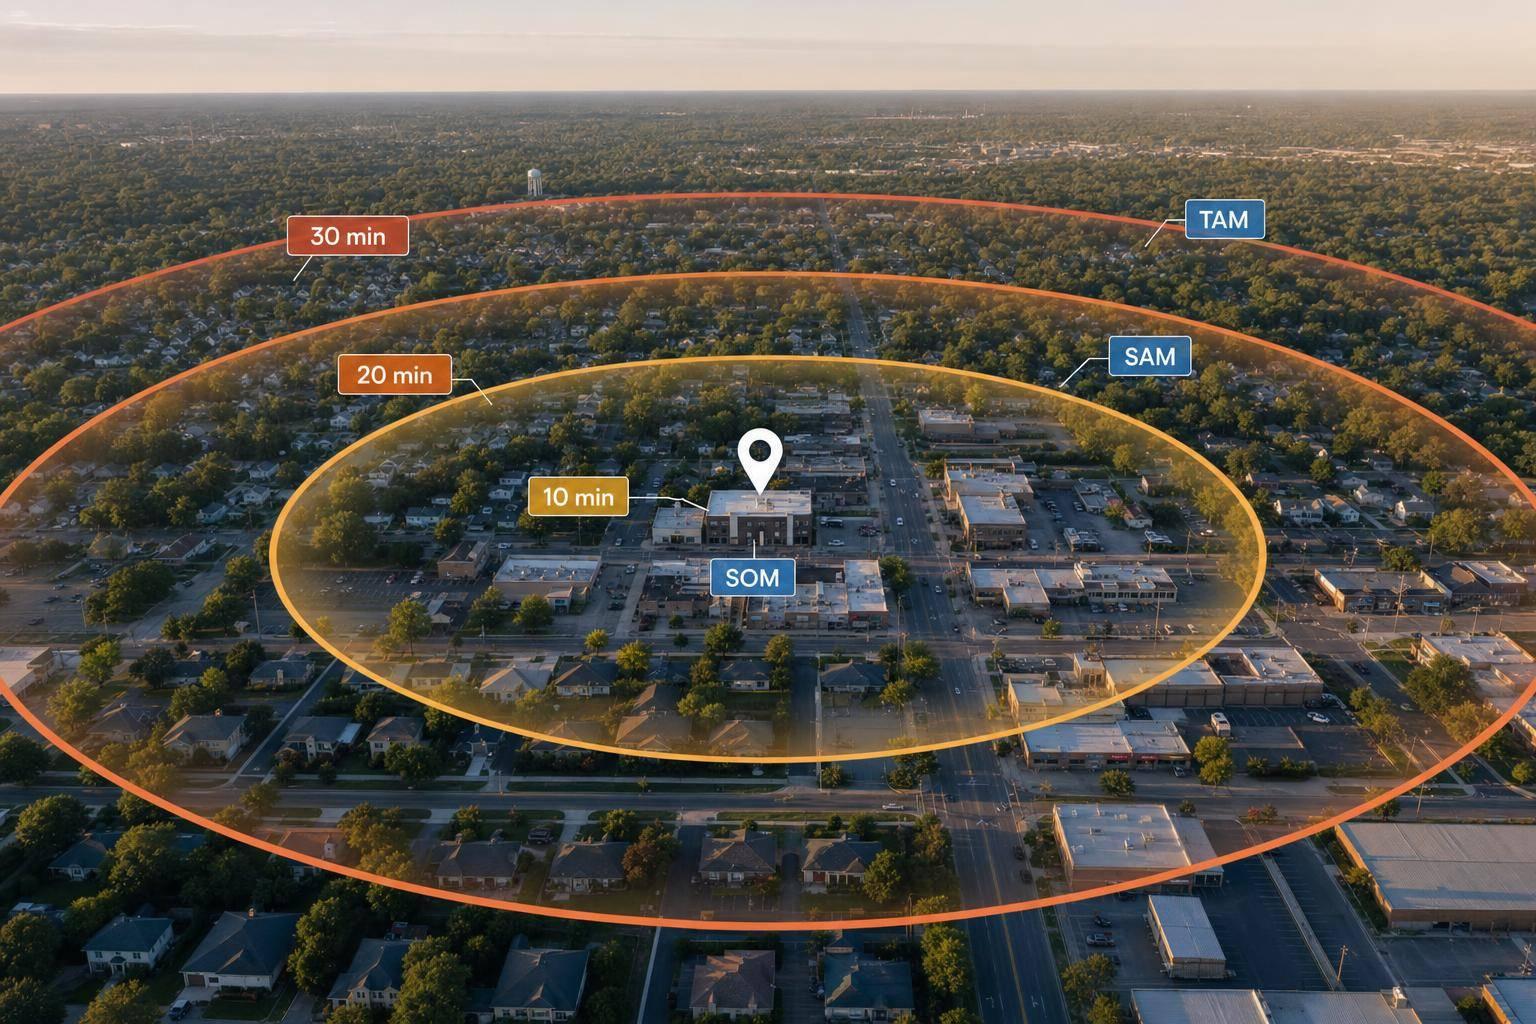
- TAM = all local demand inside my service area
- SAM = the part of that demand I can reach and want to serve
- SOM = the share I can win with my current crew, budget, and competition
- For home services, I focus on owner-occupied homes, not just total population
- I use drive time, not a simple radius, because a 20–30 minute trip can change margins fast
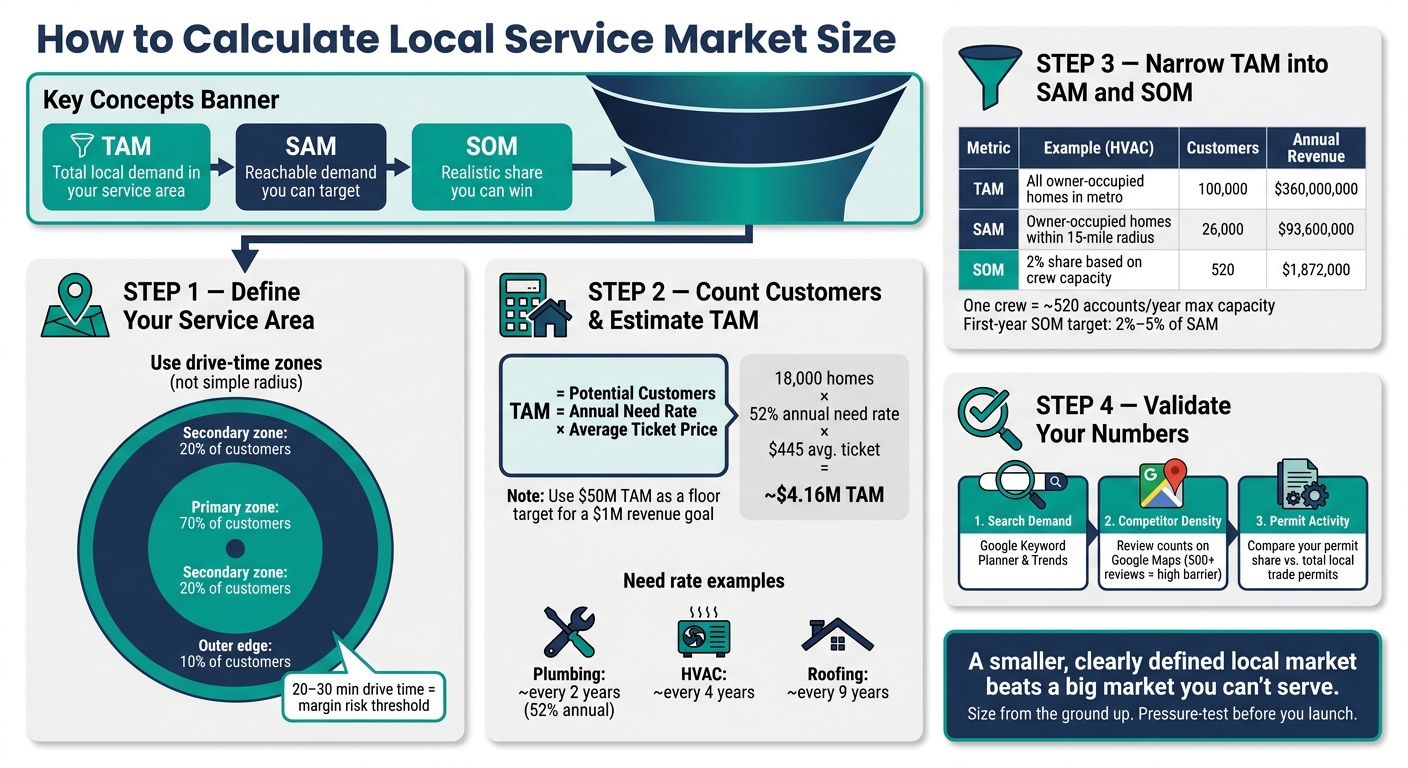
- A basic formula is: Potential Customers × Annual Need Rate × Average Ticket Price
- Example: 18,000 homes × 52% annual need rate × $445 = about $4.16 million
- I then check the math against signals like search demand, competitor review counts, and permit activity
A few points matter most:
- A local market has a hard boundary: if I can’t serve it at a profit, it should not be in my market size.
- A smaller area can beat a larger one if travel time cuts into job count and profit.
- Filters like income, housing age, homeownership, and business type help stop overcounting.
- For many new service businesses, a first-year SOM of 2% to 5% of SAM is a fair starting point.
- Crew capacity sets a hard cap. If one crew can handle 520 accounts per year, that limit matters more than a big headline market number.
| Metric | What it means | What I use it for |
|---|---|---|
| TAM | Total local demand | Check if the area is big enough |
| SAM | Reachable target demand | Focus on the right customers |
| SOM | Likely share I can serve | Plan revenue, hiring, and launch pace |
Bottom line: I size a local market from the ground up, using local customer counts and spending data, then pressure-test the estimate before I make a launch or expansion call.
Now I’ll walk through how that works step by step.
How to Calculate Local Service Market Size: TAM, SAM & SOM
TAM, SAM & SOM Explained (Using a Simple Electrician Example)
sbb-itb-08dd11e
Step 1: Define a realistic service area
Start by defining the exact area you can serve at a profit. That line becomes the limit for your market size, and it decides what belongs in TAM, SAM, and SOM.
Map your core and secondary zones with Google Maps
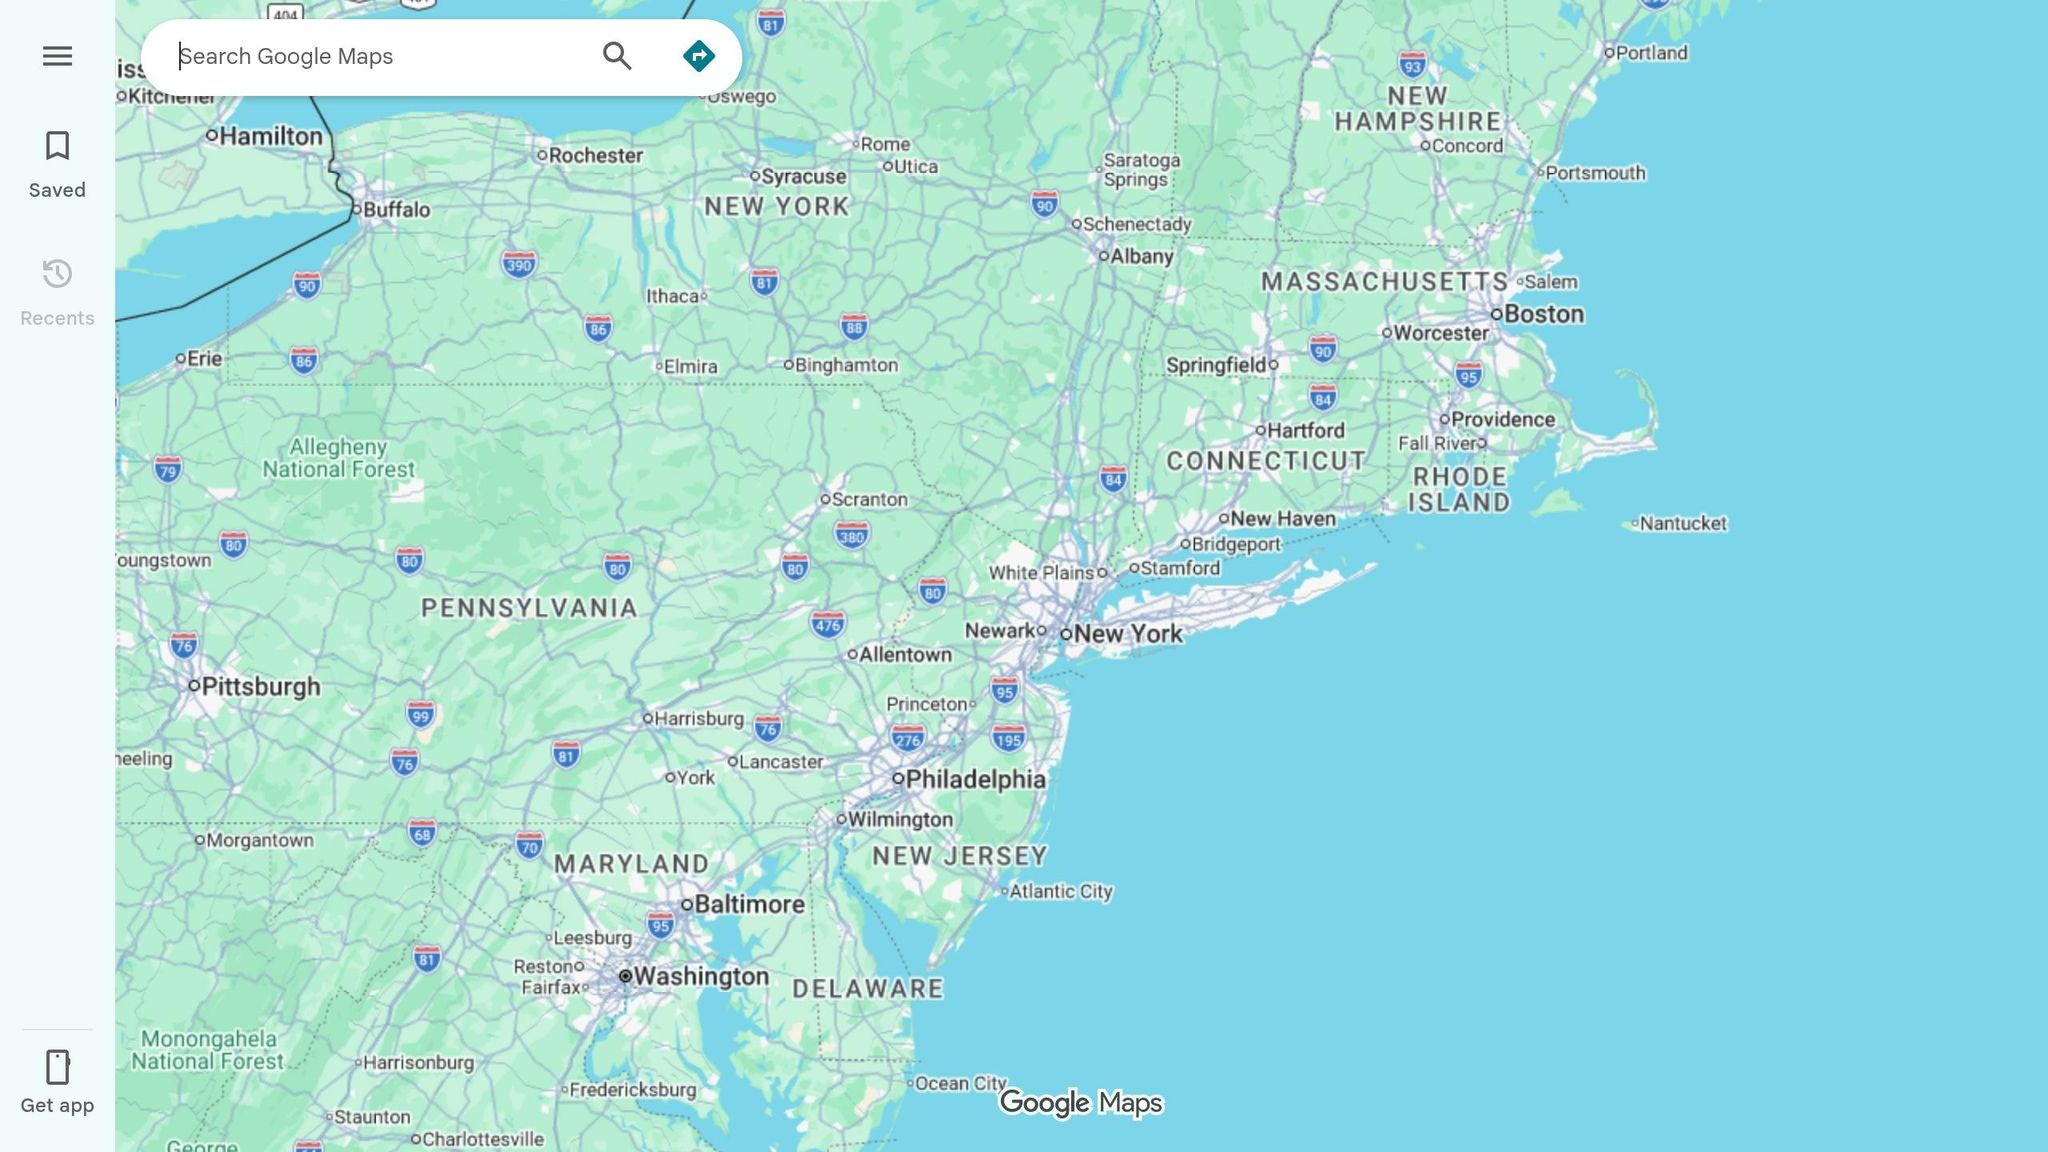
Use Google My Maps to draw your service zones. Then import addresses from past completed jobs so you can spot where work tends to cluster. Instead of using a simple radius, use drive-time polygons. They reflect roads, traffic, rivers, and highways much better.
Set up two clear zones:
- A primary zone for most jobs
- A secondary zone for overflow work
The 70/20/10 rule is a good starting point: about 70% of customers should come from the primary zone, 20% from the secondary zone, and 10% from the outer edge. For many residential services, once a job is more than a 30-minute drive away, margins can shrink fast.
This also helps you connect territory to demand. Think of it like this: the primary zone holds your core demand, the secondary zone holds spillover demand, and the outer edge is lower-confidence demand.
Write down excluded areas too. A ZIP code may sit inside your radius and still be a bad fit. Maybe a six-lane highway cuts it off with only a few crossings. Maybe traffic in one neighborhood turns every afternoon job into a late arrival. On paper, those places look reachable. In practice, they burn crew time and fuel.
You’ll use this boundary in the next step when you count demand.
Compare small and large service areas before sizing the market
Before you lock in your market size assessment, compare a tight service area with a wider one. That choice changes how many customers you can reach and how many you can serve well.
| Factor | Small Service Area | Large Service Area |
|---|---|---|
| Travel Time | Low; more billable time | High; major drive time for crews |
| Job Volume | Lower ceiling; fewer reachable customers | Higher potential; reaches more households |
| Fuel & Maintenance | Lower; less wear and tear | High; more fuel and maintenance |
| Scheduling Efficiency | High; easier to cluster jobs | Low; harder to coordinate multiple calls per day |
| Customer Experience | Faster arrivals; higher reliability | Slower response; higher risk of delays |
| Profitability | Higher margins per job | Needs higher job minimums to offset travel costs |
For lower-ticket services, a tighter area is usually the better move for profit. Higher-ticket projects can often support longer drive times. So don’t set your zone based only on how far you’re willing to drive. Set it based on average ticket size and the math of travel.
Step 2 uses this boundary to count households and businesses.
Step 2: Count potential customers and estimate local TAM
Count the households and businesses inside your service area, then turn that demand into dollars. The key is simple: use the boundary from Step 1 so you count only demand you can actually reach. For home services, focus on owner-occupied homes. For commercial work, count business establishments.
Use Census and local data to measure households, income, and business counts
For residential service businesses, total population doesn't tell you much. What matters more is owner-occupied homes, because renters usually aren't the ones approving major repair or replacement work. Use Census ACS Table B25003 (Tenure) to find owner-occupied units in your area.
Then add two filters.
- Median household income helps you spot areas that can support your prices.
- Housing age helps you estimate repair demand. The median U.S. owner-occupied home is 41 years old.
For commercial work, use Census County Business Patterns (CBP) to count establishments by NAICS code. That includes codes like 238220 for plumbing/HVAC contractors and 561730 for landscaping. If you want a quick read on demand, check local search volume in Google Keyword Planner or Google Trends.
Build a bottom-up TAM estimate with a simple formula
TAM = Potential Customers × Annual Need Rate × Average Ticket Price
That middle input, the annual need rate, is where people often get sloppy. And it matters a lot. Need rates change by trade: plumbing is about every 2 years, HVAC about every 4, and roofing about every 9.
Here’s a simple example for a residential plumber moving into a market with 18,000 owner-occupied homes:
TAM = 18,000 homes × 52% annual need rate × $445 avg. ticket = ~$4.16 million
That $445 number is the 2026 national average order value for plumbing jobs. A rough rule of thumb: use $50 million TAM as a floor if you're trying to build a business toward $1 million in annual revenue.
Use a segment table to avoid overestimating demand
Not every home or business in your service area is a likely buyer. That's where segmentation helps. It keeps you from padding your TAM with demand that looks good on paper but won't turn into jobs.
| Customer Segment | Data Source | Key Metric for TAM | Best Use in TAM |
|---|---|---|---|
| Residential Homeowners | Census ACS | Owner-occupied units | High (Repairs, replacements, landscaping) |
| Commercial Businesses | Census CBP | Establishments by NAICS | Medium (Maintenance contracts, build-outs) |
| Property Managers | Local Directories | Number of "doors" managed | High (Recurring volume, lower margins) |
| New Construction | Building Permits | Permits per contractor | Low (High competition, lower margins) |
For most home service companies, residential homeowners are the main segment. Property managers can bring steady job flow, but margins are often tighter. New construction usually looks bigger than it is, so it's often a poor choice for core TAM.
Use these inputs to narrow TAM into SAM in the next step.
Step 3: Narrow TAM into SAM and SOM
Your TAM from Step 2 is the ceiling. It is not the number you should plan around. The next step is to shrink that big number into the part of the market you can reach now and the part you can win.
Filter TAM into SAM using geography and ideal customer criteria
Start with your core service area. Then narrow it based on the kind of customer that fits your offer.
For residential jobs, filter by property traits that line up with what you sell. If you offer a premium service, tighten SAM even more by looking at higher-income households inside your service area. For commercial work, one common filter is companies with 5–49 employees.
Service type matters too. A pool service company should count only homes with pools. A garage door company should count homes with garages.
Estimate SOM based on capacity and local competition
SOM is the share of the market your business can serve in practice.
If one crew can handle 520 accounts per year, that sets your SOM ceiling. Then look at how packed the local market is. If two or three big players already hold 80% of the market, a cautious first-year SOM of 1% to 2% makes more sense. For a new local business, 2% to 5% of SAM is a practical first-year goal.
Summarize TAM, SAM, and SOM in one decision table
Here’s what that funnel can look like for a hypothetical HVAC business:
| Metric | Definition | Example Assumption (HVAC) | Customer Count | Annual Revenue (USD) |
|---|---|---|---|---|
| TAM | Total potential demand | All owner-occupied homes in the metro area | 100,000 | $360,000,000 |
| SAM | Reachable segment | Owner-occupied homes within a 15-mile radius | 26,000 | $93,600,000 |
| SOM | Realistic capture | 2% market share based on current crew capacity | 520 | $1,872,000 |
Assumes $3,600 in annual spend per household.
This table gives you a simple way to compare the full market, the slice you can reach, and the slice you can serve right now. That makes it much easier to size a launch before you pressure-test those assumptions in Step 4.
Step 4: Test your assumptions and put the numbers to work
Before you act on the numbers, stress-test your assumptions.
Cross-check your estimate with real-world signals
Start with search demand. Google Keyword Planner and Google Trends can show local search volume for specific service categories, which gives you a direct read on local demand. If local search volume is climbing and population growth is above average, demand is likely stronger.
Next, check competitor density. Look at how many businesses in your category show up on Google Maps and in local directories. Then look at review counts for the top results. If the top 10 competitors each have 500+ reviews, reputation is a serious barrier to entry.
For permit-heavy trades, permits give you the clearest reality check. Compare your permit share with total local permits in that trade. That gives you a clean read on the licensed slice of your market.
Use IdeaFloat to refine TAM, SAM, and SOM and connect market size to launch planning
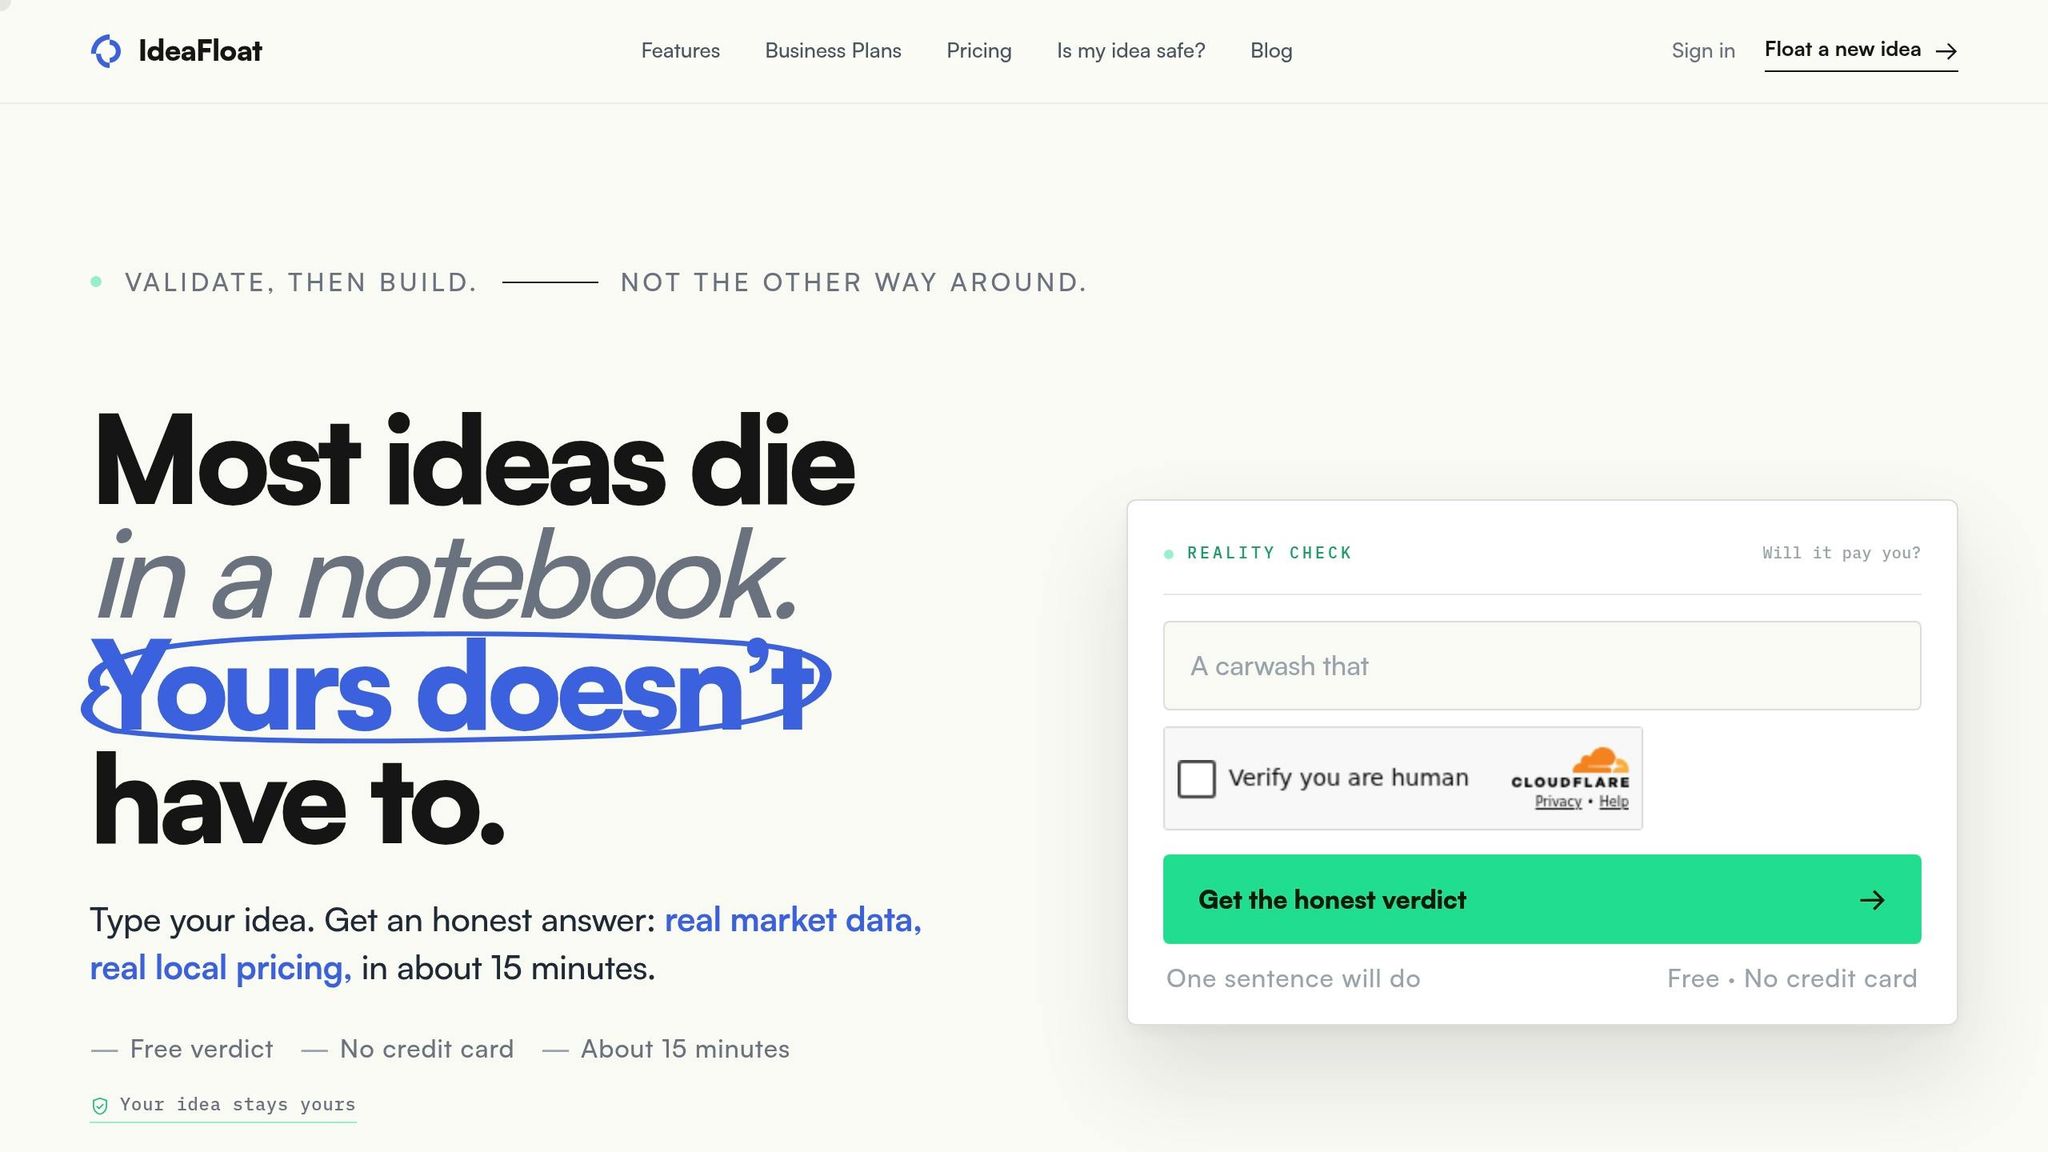
Manual market sizing can take weeks, and by the time you're done, parts of the data may already be old. IdeaFloat's Smart Market Sizing tool cuts that process down by using live local signals.
Once your market signals line up, use live local data to tighten the estimate. IdeaFloat scans the web for local business activity and demand signals, which adds a real-time layer that static databases miss. That matters because you end up with a market estimate you can use right away. From there, you can tie the numbers to pricing, staffing, and expansion plans.
| Feature | Manual Spreadsheet Sizing | IdeaFloat-Assisted Sizing |
|---|---|---|
| Speed | Weeks of manual data collection | Hours to generate reports |
| Updateability | Static; requires manual re-entry | Continuous; refreshed with live web data |
| Research Depth | Relies on broad industry averages | Hyper-local; scans live web for active buyers |
| Decision Usefulness | Outdated data | Specific opportunity zones |
Conclusion: A simple process to judge whether your local market is big enough
If the numbers still hold after validation, that's a workable launch signal. A smaller, clearly defined local market is almost always more useful than a big market you can't reach.
When people overestimate a local market, the fallout shows up fast: weak pricing, wasted spend, and slow growth. Your numbers don't need to be perfect. They just need to give you enough clarity to decide if you should launch, where to focus, and when to expand.
FAQs
How do I estimate my annual need rate?
Estimate it based on how often your target customers tend to need your service each year.
For episodic trades, take the total number of owner-occupied homes in your service area and divide it by the trade’s average cycle in years.
You can also multiply owner-occupied homes by a trade-specific annual need percentage. For example, plumbing has an average two-year cycle. So, about 52% of owner-occupied homes need plumbing services each year.
What if I serve both homes and businesses?
Treat homes and businesses as separate segments in your market sizing.
That split matters because they don’t buy the same way. Their decision process is different, their budgets are different, and the average deal size is usually different too. If you lump them together, your TAM, SAM, and SOM can get blurry fast.
Here’s the simple way to handle it:
- Use residential household counts for the home segment
- Use business establishment counts for the business segment
- Assign a different average revenue or price point to each group
- Estimate each segment on its own first, then combine them
This gives you a more accurate view of the market for each customer group, instead of forcing two very different audiences into one number.
How often should I update my market size?
Market sizing isn’t a one-and-done task. It needs regular updates so your numbers stay accurate as markets, competitors, and customer behavior change.
A simple rule: refresh your figures when new data comes out or on a set schedule, like during monthly lead campaigns. If your research changes or industry benchmarks move, update your assumptions too.
Related Blog Posts
- 7 Steps to Validate Your Business Idea Before Launch
- Market Size Without Guesswork: A Simple TAMtoSAMtoSOM Calculator
- Why Most Market Size Calculations Are Completely Wrong
- High-Demand, Low-Competition Service Businesses by City Size