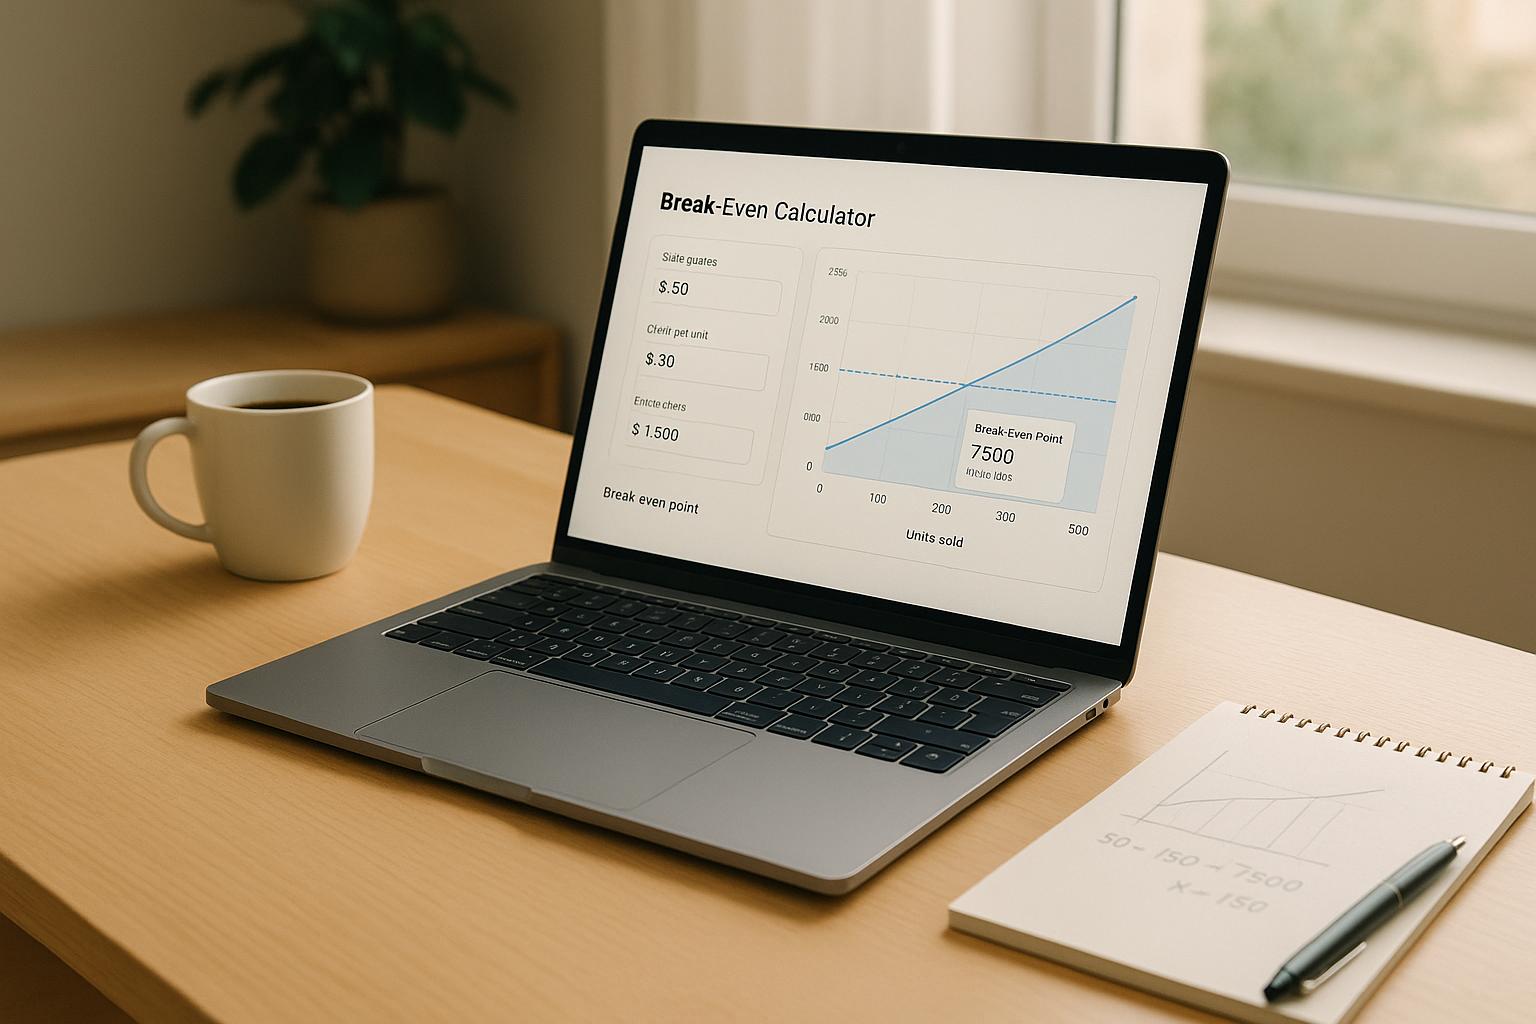
Want to know when your business will stop losing money? Understanding your breakeven point is essential. It’s the point where your revenue equals your costs, giving you clarity on pricing, sales goals, and profitability timelines.
Here’s the good news: You don’t need spreadsheets or hours of calculations anymore. IdeaFloat’s AI-powered breakeven calculator simplifies the process to just 15 minutes. Input your business data, and it calculates key metrics like breakeven revenue, units, and time, while also offering scenario planning for better decision-making.
Whether you run a product-based, service-based, or SaaS business, this tool adapts to your model. For example:
- A candle business learns it needs to sell 138 units monthly to break even.
- A SaaS company sees it requires 416 subscribers to cover costs.
- A home inspection service finds it needs 13 clients per month for profitability.
Ready to take control of your finances? This calculator helps you set clear sales goals, adjust pricing, and plan for growth with ease.
Excel - Breakeven in Units and Sales
Key Financial Metrics You Need to Know
Grasping these essential financial metrics is critical for accurately using a breakeven calculator.
Fixed Costs and Variable Costs
Understanding fixed and variable costs is the first step in managing your business's finances effectively.
Fixed costs are the expenses that stay the same no matter how much - or how little - you sell. For example, whether your monthly sales hit 10 units or 10,000, costs like $2,500 for office rent, $400 for insurance, and $8,000 in salaries won’t change.
Take a small retail business in Denver as an example. Their fixed costs might include $3,200 per month for storefront rent, $250 for utilities, $50 in business license fees, and $4,500 for a full-time manager's salary. These are the expenses that need to be covered before the business can even start to think about profit.
Variable costs, on the other hand, rise and fall with your sales volume. These include things like raw materials, packaging, shipping, and sales commissions. For instance, a bakery’s costs for flour, sugar, eggs, and packaging materials increase with every cake they bake. Similarly, if it costs $18 to make and package a piece of handmade jewelry, selling 100 pieces would result in $1,800 in variable costs, while selling 500 pieces would push that to $9,000.
The balance between fixed and variable costs matters. Businesses with high fixed costs need to sell a lot to break even, while those with high variable costs face slimmer profit margins as sales grow.
With this distinction clear, let’s look at how pricing each unit impacts profitability.
Contribution Margin and Selling Price Per Unit
The contribution margin is a critical metric that shows how much revenue remains after covering variable costs. This leftover amount helps pay for fixed costs and, eventually, contributes to profit.
To figure out the contribution margin per unit, subtract the variable cost per unit from the selling price. For example, if you sell custom phone cases for $35 each and your variable costs (materials, packaging, shipping) are $12 per case, your contribution margin per unit is $23.
For the total contribution margin, subtract total variable costs from total revenue. If you sell 200 phone cases at $35 each, your total revenue is $7,000. After deducting $2,400 in variable costs (200 × $12), the total contribution margin is $4,600.
The contribution margin ratio goes a step further, dividing the contribution margin by total revenue. In this case, $4,600 divided by $7,000 gives a 65.7% ratio. This means 65.7% of each dollar earned goes toward covering fixed costs and generating profit.
When it comes to the selling price per unit, it’s not just about covering expenses. Your price needs to support long-term growth. Pricing too low might make it harder to hit your breakeven point, so it’s essential to strike the right balance.
Now, let’s explore how SaaS businesses use MRR for breakeven analysis.
SaaS Metrics: Monthly Recurring Revenue (MRR)
For subscription-based businesses, Monthly Recurring Revenue (MRR) replaces traditional unit-based calculations. MRR provides a steady and predictable measure of revenue, making it a key metric for breakeven analysis.
To calculate MRR, multiply the number of active subscribers by the average monthly fee. For example, a project management software company with 150 subscribers paying $29 per month generates $4,350 in MRR. Adding 50 enterprise customers at $99 per month boosts the total MRR to $9,300.
MRR simplifies breakeven analysis because it ties directly to monthly fixed costs. Imagine a SaaS company with $12,000 in fixed costs (for salaries, hosting, and office expenses) and variable costs of $5 per customer (for support and payment processing). With 200 customers, variable costs total $1,000, making the breakeven MRR $13,000 ($12,000 + $1,000). If the MRR is only $9,300, the business falls $3,700 short, emphasizing the need to grow its subscriber base.
How to Use the Plug-and-Play Breakeven Calculator
IdeaFloat's breakeven calculator simplifies financial analysis by automating calculations as you input your business data. It turns what might seem like a daunting task into a straightforward process.
Step-by-Step Guide to Inputting Data
To get started, you’ll need three key pieces of information: your fixed costs, variable costs per unit, and the selling price per unit. The calculator accepts standard U.S. dollar amounts for these fields.
For example:
- Fixed Costs: Enter monthly expenses like $2,800 for rent, $350 for insurance, and $5,200 for salaries, totaling $8,350.
- Variable Costs per Unit: Input $15.50 per jewelry piece, covering materials, packaging, and shipping.
- Selling Price per Unit: Set your pricing, such as $45 per item for a product or $150 per hour for consulting services.
If you’re running a service-based business, your variable costs might include supplies or subcontractor fees per client. For SaaS businesses, use your average revenue per user for the selling price, and calculate the variable cost per customer accordingly.
The calculator updates results in real time as you tweak these inputs. This flexibility allows you to experiment with different scenarios - adjusting selling prices or cost structures - to see how they influence your breakeven point and profitability.
After entering your data, review the results to gain insights into your breakeven metrics.
How to Read the Calculator Results
Once your data is in, the calculator provides key outputs: breakeven units, breakeven revenue, and time to breakeven.
- Breakeven Units: This tells you exactly how many products or services you need to sell to cover all your costs. For instance, if the calculator shows 287 units, selling your 287th item means you’ve reached breakeven - where total revenue equals total costs. Every sale beyond this point contributes to profit.
- Breakeven Revenue: This converts the breakeven units into dollars. For example, selling 287 units at $35 each equals $10,045 in breakeven revenue. This figure can guide your monthly sales targets.
- Time to Breakeven: This metric estimates how long it will take to reach profitability based on your projected monthly sales. If you plan to sell 95 units per month, it would take roughly 3 months to break even (287 units ÷ 95 units per month). This insight is invaluable for cash flow planning and deciding on funding needs.
The calculator also provides additional metrics like your contribution margin per unit and contribution margin ratio. For instance, if your contribution margin is $19.50 per unit, each sale moves you $19.50 closer to breakeven and eventual profitability.
Small changes can make a big difference. For example, raising your price by $5 could significantly reduce the number of units needed to break even. Similarly, cutting variable costs by $2 per unit might shorten your time to profitability by weeks.
A visual breakeven chart is also included, showing where your total revenue intersects with total costs. This makes it easy to see how sales volume impacts your profitability. These insights tie directly into your broader financial planning, helping you make informed decisions with confidence.
sbb-itb-08dd11e
3 Business Examples with Calculations
Here are three scenarios that highlight how IdeaFloat's breakeven calculator works across different business models. These examples showcase how the tool provides clarity for businesses with varying structures and needs.
Product-Based Business Example
Sarah owns Coastal Candle Co., a handmade candle business she started in her garage in San Diego. She sells premium soy candles through her website and at local farmers markets.
Her monthly fixed costs add up to $2,650, which include:
- $800 for workspace rent
- $450 for insurance and licenses
- $1,200 for part-time wages
- $200 for marketing and hosting
Each candle comes with variable costs of $8.75, broken down as follows:
- $4.25 for soy wax and wicks
- $1.50 for glass containers
- $2.00 for essential oils and fragrances
- $1.00 for packaging and shipping materials
Sarah sells each candle for $28.00 through her direct-to-consumer channels.
When she inputs these numbers into the breakeven calculator, here's what she learns:
- Each candle sold contributes $19.25 toward covering fixed costs and generating profit ($28.00 - $8.75).
- To break even, she needs to sell about 138 candles per month ($2,650 ÷ $19.25), which translates to $3,864 in monthly revenue (138 × $28.00).
Currently selling 45 candles monthly, Sarah realizes she needs to nearly triple her sales to hit the breakeven point. This insight points to the need for stronger marketing and distribution efforts to achieve profitability.
SaaS Business Example
TaskFlow, a project management tool designed for small creative agencies, used the calculator to evaluate its path to profitability in a competitive market.
Their monthly fixed costs total $18,500, allocated as follows:
- $12,000 for developer salaries
- $3,200 for cloud hosting and infrastructure
- $2,000 for customer support tools
- $800 for marketing software
- $500 for legal and accounting services
The variable cost per customer is $4.50 per month, covering:
- $1.50 for payment processing fees
- $2.00 for customer onboarding costs
- $1.00 for additional server resources per user
TaskFlow charges $49.00 per month for its standard plan, representing its average revenue per user.
Using the calculator, TaskFlow discovers:
- Each customer contributes $44.50 monthly toward fixed costs and profit ($49.00 - $4.50).
- They need approximately 416 paying customers to break even ($18,500 ÷ $44.50), generating $20,384 in monthly recurring revenue.
With 35 new customers joining each month, TaskFlow estimates it can reach breakeven within 12 months. Factoring in customer churn, they aim for 450–500 customers to ensure stability. Additionally, a small price increase of $6 could reduce the breakeven point to around 375 customers, speeding up profitability. These insights help refine their pricing and customer acquisition strategies.
Service-Based Business Example
Mike Rodriguez, owner of Elite Home Inspections, provides residential property inspection services in the Dallas-Fort Worth area. He used the breakeven calculator to evaluate his pricing and operational capacity.
For service businesses, defining the "unit" is key. Mike chose individual inspections as his unit since each inspection represents a completed service.
His monthly fixed costs total $4,800, including:
- $1,800 for vehicle payments and insurance
- $1,200 for professional liability insurance
- $900 for office rent and utilities
- $600 for marketing and lead generation
- $300 for software subscriptions and equipment maintenance
The variable cost per inspection is $45.00, covering:
- $25.00 for fuel and vehicle wear
- $12.00 for inspection report software and printing
- $8.00 for miscellaneous supplies and equipment usage
Mike charges $425.00 per inspection, aligning with market rates.
The calculator reveals:
- A $380 contribution margin per inspection ($425.00 - $45.00).
- A breakeven point of about 13 inspections per month ($4,800 ÷ $380), generating approximately $5,525 in monthly revenue.
Currently conducting 8–10 inspections monthly, Mike sees he has the capacity to handle 13 inspections without hiring additional staff. He also considers introducing a premium service tier at $525. If just 30% of his customers choose this option, his breakeven point could drop to around 11 inspections per month.
How to Use Your Results for Business Planning
Once you've reviewed your calculator's outputs, it’s time to put those insights to work. Your breakeven analysis isn’t just a number - it’s a foundation for shaping your sales and pricing strategies. These results can guide everything from setting revenue goals to planning for growth. Here’s how to use those findings to create actionable strategies for your business.
Setting Sales and Pricing Goals
Your breakeven point is a starting line for setting realistic sales targets and pricing strategies.
Start by setting monthly sales goals that go beyond your breakeven figure by 20–30%. This buffer helps cover unexpected fluctuations. For instance, if your breakeven analysis shows you need to sell 138 units per month (like Sarah’s candle business), aim for 175–180 units to maintain steady profitability.
Next, use your contribution margin to explore pricing changes. Even small price adjustments can significantly impact your breakeven point. For example, increasing a product price from $49.00 to $55.00 raises the contribution margin, lowering the breakeven point from 416 to 366 customers.
You can also experiment with tiered pricing strategies based on your breakeven insights. Take Mike’s inspection business as an example - he could offer a premium service at $525 while keeping a standard option at $425. If 30% of customers opt for the premium tier, the overall contribution margin improves.
Set quarterly revenue targets that align with your breakeven timeline. If you’re not yet at breakeven, establish smaller milestones to track progress. These benchmarks keep you motivated and focused on reaching profitability.
Scenario Planning with Comparison Tables
Simulate different scenarios by adjusting costs, prices, and sales volumes to see how these changes impact profitability.
Here’s an example of pricing and cost scenarios:
| Scenario | Monthly Price | Variable Cost | Contribution Margin | Breakeven Point | Monthly Revenue |
|---|---|---|---|---|---|
| Current | $49.00 | $4.50 | $44.50 | 416 customers | $20,384 |
| Price Increase | $55.00 | $4.50 | $50.50 | 366 customers | $20,130 |
| Cost Reduction | $49.00 | $3.00 | $46.00 | 402 customers | $19,698 |
| Combined | $55.00 | $3.00 | $52.00 | 356 customers | $19,580 |
This table shows that combining a price increase with cost reductions can significantly lower the number of customers needed to hit profitability.
You can also model production levels to assess capacity needs. For example, Sarah’s candle business might explore these options:
| Production Level | Fixed Costs | Units Needed | Revenue Target | Profit Margin |
|---|---|---|---|---|
| Current (Home) | $2,650 | 138 | $3,864 | 31% |
| Small Workshop | $4,200 | 218 | $6,104 | 27% |
| Commercial Space | $6,800 | 353 | $9,884 | 24% |
These scenarios highlight how scaling operations impacts profitability, helping you plan for different stages of growth.
Don’t forget to account for seasonal fluctuations. Many businesses face revenue ups and downs throughout the year, so it’s smart to build a surplus during peak times to prepare for slower periods. These insights can guide adjustments in your broader business strategy.
Connecting Breakeven Analysis with Other IdeaFloat Tools

Take your insights further by integrating them with IdeaFloat’s suite of business planning tools. Your breakeven analysis can seamlessly connect with other resources to create a well-rounded financial strategy.
- Financial Projections & Breakeven Analysis: Extend your calculations into monthly forecasts, showing when you might reach profitability and whether you’ll need external funding.
- Advanced Pricing Research: Validate your pricing assumptions by analyzing market data and applying proven pricing strategies.
- Cost Analysis: Break down your expenses in detail to refine your breakeven calculations.
- Go-to-Market Strategy: Align your customer acquisition efforts with profitability goals.
- Smart Market Sizing: Check if your breakeven targets are achievable within your target audience.
- Business Plan Generator: Export your breakeven analysis alongside other planning documents for a complete overview of your business.
Conclusion
Figuring out your breakeven point doesn’t have to feel like a daunting task. With the right tools, you can turn what once seemed like hours of tedious spreadsheet work into a focused strategy session that provides clarity for your business.
Key Points Recap
The IdeaFloat breakeven calculator is designed with busy entrepreneurs in mind, offering speed, simplicity, and actionable insights. Say goodbye to complicated formulas - this tool helps you complete your breakeven analysis and financial validation in just 15 minutes.
It’s not just quick; it’s tailored to your needs. Whether you’re running a product-based business like Sarah’s candle company, a SaaS platform, or Mike’s inspection service, the calculator adjusts to fit your specific business model. Along the way, it provides reliable, data-driven insights to guide your decisions.
One of its standout features is the interactive graphs, which clearly illustrate when your business will hit profitability and how much funding might be required. But this isn’t just about reaching a breakeven number - it’s about understanding the financial dynamics that fuel your success. With this knowledge, you can make smarter decisions about pricing, costs, and growth strategies.
The tool also equips you for investor meetings by laying out financial projections and reinforcing your business fundamentals. Explaining your breakeven point with confidence shows investors you’ve done the work and understand the financial backbone of your business. These insights empower you to make well-informed, swift decisions that drive your business forward.
Next Steps for Entrepreneurs
Now that you’ve got these insights, it’s time to put them into action. Use your breakeven analysis as a stepping stone to set realistic sales goals, fine-tune pricing, and plan for growth.
Consider diving deeper into IdeaFloat’s full suite of business validation tools. These tools integrate seamlessly with your breakeven insights, offering support for market sizing, go-to-market strategies, and detailed financial projections - giving you a comprehensive view of your business potential.
Start building your path to profitability today. Try the IdeaFloat breakeven calculator and turn financial guesswork into a clear, actionable plan. Your business idea deserves more than uncertainty, and now you have the tools to move forward with clarity and confidence.
FAQs
Can the IdeaFloat breakeven calculator work for different business models like product-based, service-based, and SaaS?
The IdeaFloat breakeven calculator is designed to adapt to different business types, whether you're managing a product-based venture, a service-oriented company, or a SaaS operation. From a neighborhood café to a tech startup or a consulting business, this tool can be customized to align with your specific needs.
By allowing you to input essential details like costs, pricing, and revenue estimates, it streamlines the breakeven analysis process. This makes it an excellent resource for entrepreneurs looking for fast, data-backed insights to assess the viability of their ideas.
What financial details should I know before using the breakeven calculator?
To make the most of a breakeven calculator, it's crucial to understand a few essential financial components:
- Fixed costs: These are the expenses that remain constant regardless of how much you produce or sell. Think of things like rent, utilities, or employee salaries.
- Variable costs: These are the costs that change depending on your production or sales volume, such as raw materials or direct labor.
- Selling price per unit: This is the amount you charge customers for a single unit of your product or service.
By having a solid understanding of these numbers, you can ensure accurate calculations and make smarter, faster business decisions.
How can I use the breakeven calculator to set achievable sales and pricing goals for my business?
The breakeven calculator is a handy tool for figuring out exactly how many units you need to sell to cover your expenses and begin turning a profit. Knowing this key number helps you set achievable sales targets and fine-tune your pricing strategies to match your financial objectives.
With the results, you can assess whether your pricing remains competitive while still covering costs. It also highlights areas where you could cut expenses or improve efficiency. This kind of clarity empowers you to make smarter decisions about your revenue goals, day-to-day operations, and long-term business plans.
Related Blog Posts

Get the newest tips and tricks of starting your business!