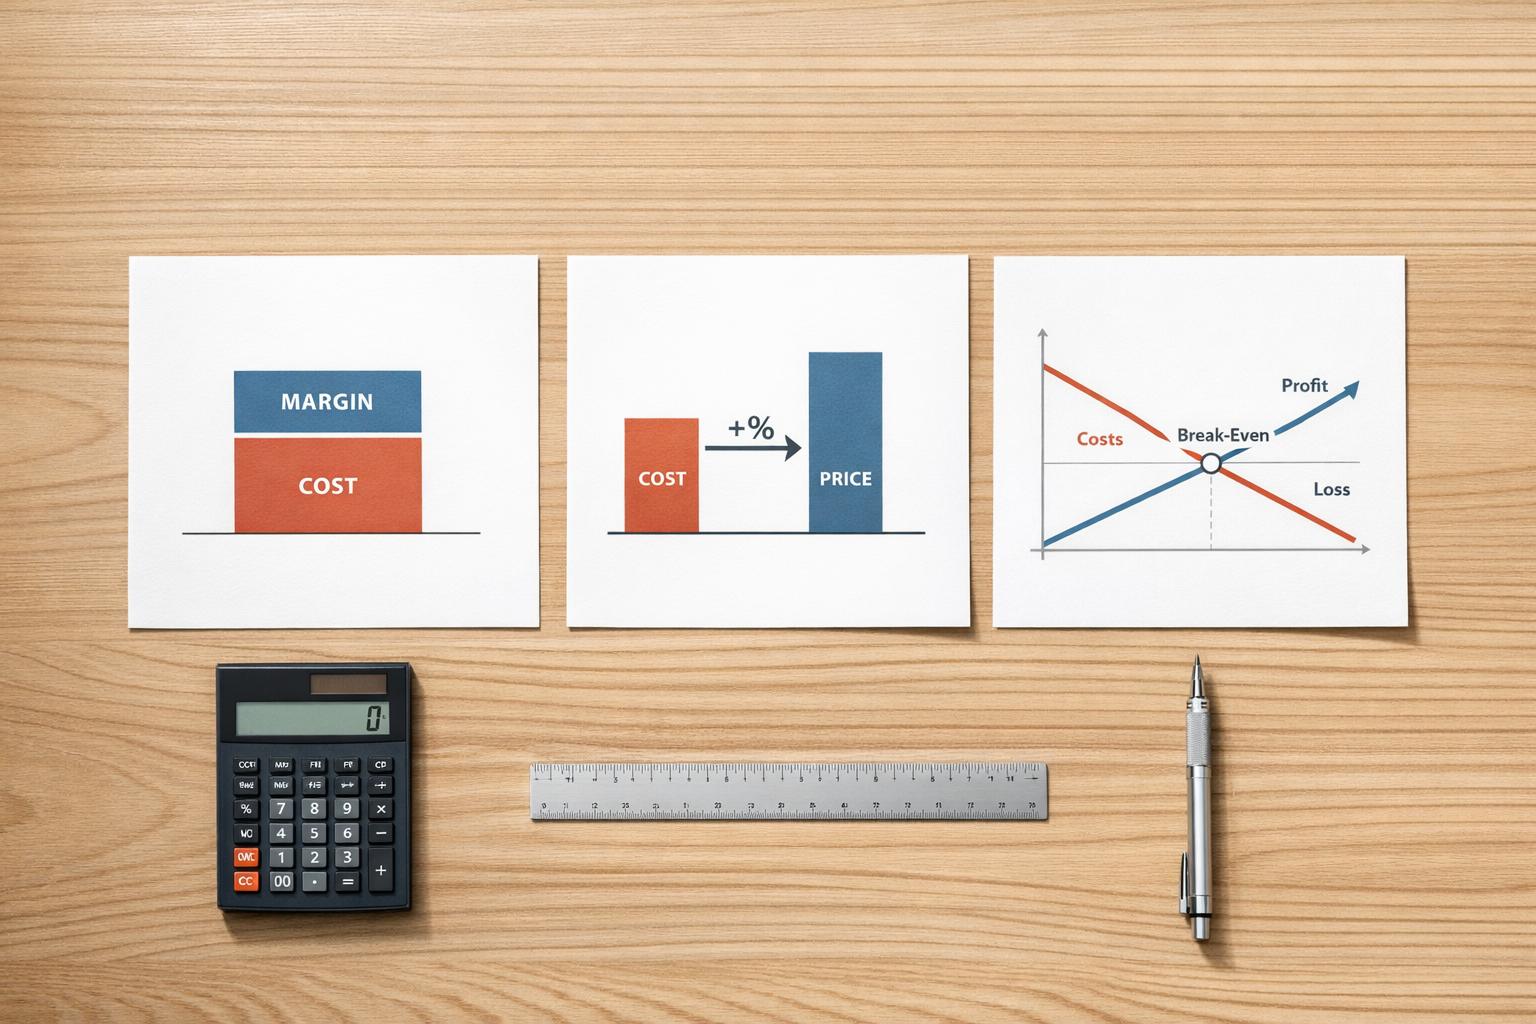
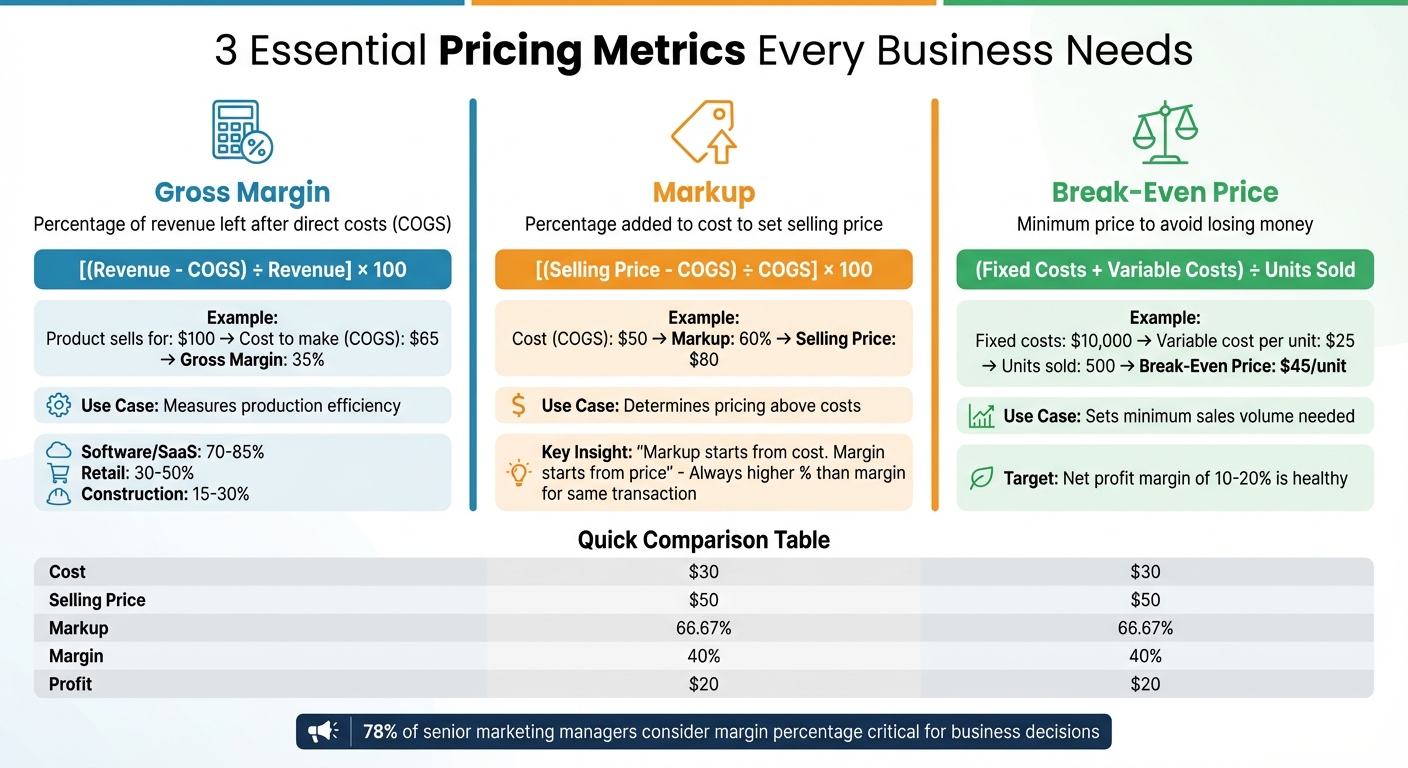
Want to price your products for profit? Gross margin, markup, and break-even price are the key numbers you need to master. These metrics help you understand your costs, set prices that cover expenses, and identify how many units you need to sell to make a profit. Here's the breakdown:
- Gross Margin: Shows how much of your revenue remains after direct costs (like materials and labor) are deducted.
Formula: [(Revenue - COGS) ÷ Revenue] × 100
Example: If your product sells for $100 and costs $65 to make, your gross margin is 35%. - Markup: Determines how much you add to your cost to set the selling price.
Formula: [(Selling Price - COGS) ÷ COGS] × 100
Example: A $50 product with a 60% markup sells for $80. - Break-Even Price: The minimum price you need to charge to avoid losing money.
Formula: [(Fixed Costs + Variable Costs) ÷ Units Sold]
Example: With $10,000 in fixed costs, $25/unit variable costs, and 500 units sold, your break-even price is $45/unit.
Why does this matter? These calculations ensure you’re covering costs, pricing competitively, and staying profitable. Keep reading for step-by-step examples and actionable tips to apply these metrics in your business.
Gross Margin vs Markup vs Break-Even Price: Formulas and Examples
What Is Gross Margin?
Gross Margin Definition
Gross margin measures the percentage of revenue left after subtracting the direct costs of producing goods or services (COGS). These costs typically include raw materials, direct labor, and shipping. For instance, if you sell a product for $100 and it costs $65 to make, your gross profit is $35, giving you a 35% gross margin.
Unlike gross profit, which is a dollar figure, gross margin is expressed as a percentage. This makes it easier to compare performance across businesses of different sizes or to track efficiency improvements over time. It's important to note that indirect expenses - like rent, administrative salaries, or utilities - are not part of this calculation.
Grasping this concept is essential for understanding how to calculate and use gross margin effectively.
Why Gross Margin Matters
Gross margin provides a clear picture of how efficiently a company turns sales into profit before accounting for overhead expenses. It highlights the funds available for covering operating costs, paying off debt, or fueling growth. A survey of nearly 200 senior marketing managers revealed that 78% consider margin percentage a critical metric for making business decisions.
A declining gross margin can indicate rising production costs or reduced pricing power, signaling the need to reevaluate expenses or pricing strategies. Service-oriented businesses often report higher gross margins compared to manufacturers due to their lower direct costs. For example, software companies often achieve margins between 80% and 90%, while capital-intensive industries like farming or steel production typically operate closer to 15%.
"Gross margin represents a firm's ability to maintain revenue above the direct costs of goods and services produced, highlighting its core business profitability before incorporating additional expenses." – Investopedia
Understanding gross margin is key to making informed business decisions and crafting effective pricing strategies. Up next, learn how to calculate gross margin and put this metric to use.
How to Calculate Gross Margin
The Gross Margin Formula
Calculating gross margin is simple:
Gross Margin (%) = [(Total Revenue - COGS) / Total Revenue] × 100
To break it down, you need two key figures: Total Revenue and Cost of Goods Sold (COGS). Total Revenue is your net sales after deducting returns, discounts, and allowances. COGS, on the other hand, includes only the direct costs, such as raw materials and direct manufacturing labor.
It's important not to confuse gross profit with gross margin. Gross profit is the dollar amount left after subtracting COGS from revenue. Gross margin, however, expresses this as a percentage. For instance, a gross margin of 30% means your business keeps $0.30 from every dollar of sales to cover operating costs and generate profit.
Let’s see how this works in practice.
Gross Margin Calculation Example
Here’s a practical example to illustrate the formula: imagine your business earns $50,000 in revenue over a quarter and incurs $30,000 in COGS (covering materials and direct labor).
- Start by calculating the gross profit:
$50,000 - $30,000 = $20,000 - Then, determine the gross margin percentage:
($20,000 ÷ $50,000) × 100 = 40%
This means your gross margin is 40%, or in simpler terms, you retain $0.40 from every dollar of sales before accounting for overhead costs. This percentage is crucial for developing pricing strategies and managing your finances since it shows how much is left to handle other expenses.
To get accurate results, always use net sales (after factoring in returns and discounts). Monitoring your gross margin regularly - whether monthly or quarterly - can help you spot trends. For example, a shrinking margin might indicate the need to renegotiate supplier contracts or rethink your pricing.
Now that gross margin is clear, let’s dive into understanding markup.
What Is Markup?
Markup Definition
Markup is the percentage added to the cost of a product to determine its selling price. Meanwhile, gross margin represents the percentage of the selling price that remains as profit after covering costs. For example, if a product costs $50 and has a 60% markup, it would sell for $80.
The main difference lies in the starting point. As Tracy Ng, Senior Content Executive at TrueProfit, explains:
"Markup starts from cost. Margin starts from price".
This distinction is crucial because markup helps you decide how much to charge above your costs, while margin shows the profitability of the selling price. Interestingly, markup always appears as a higher percentage than margin for the same transaction. For instance, doubling your cost (a 100% markup) results in only a 50% profit margin.
Markup vs. Margin: The Difference
Let’s break it down with an example. If a product costs $30 and sells for $50:
| Metric | Formula | Calculation | Result |
|---|---|---|---|
| Markup | (Price - Cost) / Cost | ($50 - $30) / $30 | 66.67% |
| Margin | (Price - Cost) / Price | ($50 - $30) / $50 | 40% |
Markup focuses on costs and helps determine pricing, while margin centers on revenue and measures profitability. Use markup when setting prices, especially for wholesale, and rely on margin for analyzing the effects of discounts or promotions, as it reflects the profit retained from the final price.
How to Calculate Markup
The formula for markup is simple:
Markup (%) = [(Selling Price - COGS) / COGS] × 100
Here’s an example: if the cost of goods sold (COGS) is $40 and the selling price is $70:
($70 - $40) / $40 × 100 = 75%
This means your markup is 75%, indicating that three-quarters of the cost has been added as profit. If your supplier raises costs to $45 and you maintain a 75% markup, the new selling price would be $78.75. Being aware of this relationship allows you to quickly adjust prices when costs change, ensuring your pricing strategy remains effective and your profit margins are protected.
How to Calculate Markup and Margin on Products & Services
sbb-itb-08dd11e
How to Calculate Break-Even Price
Understanding how to calculate your break-even price is key to ensuring your business covers its costs and remains sustainable.
What Is Break-Even Price?
The break-even price is the lowest amount you can charge for a product or service without incurring a loss. Once you price above this point, you start generating profit. But if you price below it, you risk losing money.
This price calculation considers two types of costs:
- Fixed costs: These are expenses that don’t change, no matter how much you produce or sell. Think of items like rent, salaries, or insurance.
- Variable costs: These fluctuate depending on production volume. Examples include raw materials, packaging, and shipping costs.
As Stripe puts it:
"The break-even point is the moment your business stops losing money and can fully cover its costs; it's the amount of revenue you need to cover all your expenses."
Knowing your break-even price is essential for setting prices that are both competitive and profitable.
The Break-Even Price Formula
The formula to calculate the break-even price is simple:
Break-Even Price = (Total Fixed Costs + Total Variable Costs) / Units Sold
This method ensures that every unit sold contributes enough to cover both fixed and variable costs.
Break-Even Price Calculation Example
Let’s break it down with an example. Imagine you’re introducing a new product. Your monthly fixed costs are $10,000 (covering rent, salaries, and insurance). Each unit costs $25 to produce (materials, packaging, and shipping), and you plan to sell 500 units. Here’s how you calculate the break-even price:
- Calculate total variable costs:
$25 × 500 = $12,500 - Add fixed and variable costs to find total costs:
$10,000 (fixed) + $12,500 (variable) = $22,500 - Divide total costs by the number of units sold:
$22,500 ÷ 500 = $45 per unit
In this case, your break-even price is $45 per unit. This means you need to charge at least $45 to cover all costs. Anything above $45 contributes to your profit, while pricing below it results in a loss.
It’s a good idea to revisit this calculation regularly, especially if material costs, inflation, or other factors change over time.
Using These Metrics to Make Business Decisions
Now that you’ve learned how to calculate these metrics, it’s time to put them to work. They can guide you in setting prices, adjusting markups, and planning your finances with confidence.
Setting Prices Based on Gross Margin
Think of gross margin as your "cost floor" - the lowest price you can charge without losing money. But it’s more than that; it’s also a tool for making smarter pricing decisions.
Here’s how to calculate a target selling price:
Price = Total Cost / (1 - Desired Gross Margin Percentage).
For instance, if your product costs $30 to make and you aim for a 40% gross margin, your price would be $30 / (1 - 0.40) = $50.
If this price is lower than what the market typically charges, it might signal you have room to charge more. In such cases, try increasing prices by 10-20% to better reflect your product’s value.
However, if your cost floor exceeds competitor prices, the issue likely lies with your costs, not your pricing. In this case, focus on negotiating with suppliers or finding ways to reduce production expenses before revisiting your pricing structure.
When calculating your true cost floor, don’t forget to include everything: materials, labor, packaging, and merchant fees (usually 2.9% + $0.30 per transaction). If you’re a solo entrepreneur, factor in your own market-rate salary to ensure your business is sustainable.
Industry averages can also help you gauge your pricing strategy. For example:
- Software and SaaS businesses often operate with gross margins between 70% and 85%.
- Retail products typically range from 30% to 50%.
- Construction businesses tend to fall between 15% and 30%.
If your gross margin is far below your industry’s average, it’s a red flag to dig deeper into your costs. Reassess your margins quarterly to account for changes in supplier costs or shipping rates, which can quietly eat into your profits. Small businesses often underestimate overhead by 10% to 25%, leading to inflated margin estimates.
Setting Markup for Profitability
Gross margin shows how much of your revenue you keep, but markup determines how much you add to your costs. The key is finding a balance between covering expenses and setting a price your customers are willing to pay.
Businesses that use a systematic markup strategy tend to see 15-25% higher profit margins compared to those that rely on guesswork. This approach ensures consistent profitability.
Different products may require different markup rates. For example:
- Apply higher markups to unique or premium items where customers are less likely to compare prices.
- Use lower markups for highly competitive, high-visibility items where shoppers are more price-sensitive.
Pay attention to your maintained markup, which reflects your actual profit after accounting for discounts, returns, and promotions. This will help you determine whether your pricing strategy is holding up or if promotions are cutting too deeply into your margins.
For e-commerce businesses, don’t forget to include platform fees (ranging from 3% to 15%) and payment processing costs when calculating markups. Even if your calculated markup looks good on paper, it’s important to compare it to prices from 3-5 competitors to ensure it’s realistic.
Using Break-Even Analysis for Financial Planning
Beyond pricing and markup, understanding your break-even point is essential for aligning your sales goals with your costs. This metric answers the question: How many units do I need to sell to cover my expenses?
The formula is simple:
Break-Even Volume = Total Fixed Costs / (Price - Variable Cost per Unit).
This calculation gives you the minimum number of units you need to sell to avoid losing money. As Samir Messaoudi of UseACalculator.com explains:
"Break-even analysis sets your minimum required sales volume. Selling fewer than [the break-even] units loses money regardless of price."
Break-even analysis is especially useful when considering new investments. For example, before hiring staff or renting larger spaces, calculate how these added fixed costs will affect your break-even volume. If you can’t realistically sell enough to cover the higher costs, it’s probably not the right time to expand.
This analysis can also help you identify whether you’re dealing with a pricing problem or a cost problem. If your break-even sales target is far higher than what the market can support, you’ll need to either raise prices, cut costs, or rethink your business model.
For solo entrepreneurs, make sure to include your own time as a cost, using a market-rate salary. This ensures you’re building a business that’s truly profitable, not just creating an underpaid job for yourself.
Healthy small businesses generally aim for a net profit margin of 10-20%. If your profit margins consistently fall below 5%, it’s a sign you may need to revisit your pricing strategy or cut costs to create a stronger financial foundation.
Conclusion
Summary of Key Metrics
Understanding the differences between gross margin, markup, and break-even price is essential for running a successful business. Each metric serves a distinct purpose: gross margin measures production efficiency, markup reflects how much you add to costs to set prices, and break-even analysis identifies the sales volume needed to cover expenses.
These metrics also act as warning signals. For instance, a declining gross margin might indicate that production costs are rising faster than your prices. Misinterpreting these metrics can lead to costly mistakes. As Ken Boyd, a finance expert, explains:
"Profit margin isn't the same as markup. Markup focuses on how much you add to cost to set a price, not how much revenue you keep as profit."
Given that the median small business has just 27 days of cash reserves, keeping a close eye on margins is crucial. Trends are more telling than a single data point - if your margins are shrinking over time, it’s a sign to reevaluate your costs or pricing strategy.
Use these insights to fine-tune your pricing approach and make informed business decisions.
Next Steps
Start applying these metrics by recalculating your costs and pricing. Use the formulas provided earlier in this guide and compare your results to industry standards. For example, gross margins typically range from 72–80% for software companies and 30–50% for retail products. If your numbers fall short, take action in areas you can control:
- Negotiate better terms with suppliers.
- Audit recurring expenses to avoid unnecessary "subscription creep."
- Test modest price increases on your top-performing products or services.
A net profit margin of 10% is considered sustainable, while margins above 20% indicate strong performance. On the other hand, if your net profit margin consistently stays below 5%, it’s a red flag that your pricing or cost structure needs a complete overhaul.
Don’t wait for annual reviews - track your margins monthly. This proactive approach allows you to catch issues early and adjust before they impact your business’s long-term health.
FAQs
Which costs should I include in COGS?
When calculating COGS (Cost of Goods Sold), make sure to include the direct costs associated with producing or purchasing the goods your business sells. This typically means accounting for:
- Raw materials: The tangible components used to create your product.
- Direct labor: Wages paid to employees who are directly involved in production.
- Other production-related costs: Such as factory supplies or utilities tied to manufacturing.
However, do not include overhead expenses like rent, marketing costs, or administrative salaries. These fall under operating expenses, not COGS.
How do I convert a target margin into a selling price?
To figure out a selling price that meets a specific target margin, you can use this formula: Selling Price = Cost / (1 - Target Margin). Just remember to convert the margin percentage into a decimal first (for instance, 25% becomes 0.25).
Here’s an example to make it clear: If your cost is $60 and your target margin is 25%, the calculation would look like this: $60 / (1 - 0.25) = $80.
How many units do I need to sell to break even?
To figure out how many units you need to sell to break even, you can use this formula:
Break-Even Units = Fixed Costs / (Selling Price per Unit - Variable Cost per Unit)
This calculation ensures that your total revenue matches your total costs, covering both fixed and variable expenses without any profit or loss. To use this formula, you'll need three key numbers: your fixed costs, the variable cost per unit, and the selling price per unit.
Related Blog Posts

Get the newest tips and tricks of starting your business!