
Most startups fail because they misjudge market size. In fact, 70% of failures stem from this mistake. Miscalculations waste resources, scare off investors, and lead to poor decisions like chasing nonexistent opportunities.
Here’s why market size estimates often fail:
- Overreliance on top-down methods: Starting with large industry numbers and assuming a small percentage is easy but unrealistic.
- Outdated data: Using reports older than 18 months can lead to bad assumptions, especially in fast-changing industries.
- Confusing TAM, SAM, and SOM: Claiming the entire market without narrowing it down to what’s actually reachable is a red flag.
The solution? Use bottom-up methods. These rely on real customer data, pricing validation, and unit economics to build realistic, defensible numbers. Combining top-down and bottom-up approaches, checking assumptions, and using tools like AI for live data can help avoid these pitfalls.
Accurate market sizing isn’t optional - it’s the foundation for smart decisions and investor trust.
The RIGHT Way to Calculate your Market Size (TAM/SAM/SOM)
sbb-itb-08dd11e
Common Mistakes in Market Size Calculations
TAM SAM SOM Market Sizing Framework Comparison
Many startups stumble because their market size estimates miss the mark. It’s not always intentional - founders often fall into common traps that lead them to chase markets that don’t actually exist. These missteps can cost years of effort and resources.
Relying Too Much on Top-Down Approaches
Top-down methods start with a big industry number and then narrow it down. Sounds simple, right? But this approach is often misleading. A classic example is the "1% fallacy" - assuming that capturing 1% of a $10 billion market will automatically yield a $100 million business. Investors see this as oversimplified and unrealistic because it skips over critical factors like competition, customer acquisition costs, and how you’ll actually win customers.
Another pitfall is the market adjacency fallacy. Imagine a niche compliance software for regional banks claiming the $20 trillion global financial services market as its Total Addressable Market (TAM). This kind of overreach ignores real-world barriers like local regulations and market dynamics. For example, a US-based SaaS company can't just assume European customer acquisition costs apply to their model - US enterprise customer acquisition costs (CAC) can exceed 1.2 times the first year’s contract value.
"Citing a big number from an analyst report tells investors nothing except that you know how to use Google." - Vicki Politis, Founder of DeckToVC
Top-down estimates often lack customer specificity, failing to define the exact type and size of the target customer. Without this clarity, the numbers seem more like guesses than grounded projections. Plus, relying on outdated or aggregated data can further distort the picture.
Using Static and Outdated Data Sources
Markets evolve quickly, and outdated data can lead you astray. Using a three-year-old report to size your market is like relying on a map of a city that’s been completely rebuilt. In fast-moving industries like technology and finance, disruptions like AI advancements, cybersecurity threats, or new regulations (e.g., the EU AI Act) can render even 18-month-old data irrelevant.
Reports from firms like Gartner or Forrester often come with a 1-2 year publication lag, which means they miss recent trends and shifts, such as post-pandemic changes in customer behavior. And here’s a sobering stat: 42% of startup failures can be traced back to “no market need,” often because founders relied on outdated or overly optimistic data.
"If the data source is older than 18 months, treat it as directional, not definitive." - Financial Models Lab
Another issue? Regional divergence. Global averages don’t always reflect what’s happening in specific markets like the US or Southeast Asia. Investors are quick to question your numbers if they’re based on outdated sources. To stay ahead, 67% of high-growth companies now update their market analysis quarterly. Keeping your data current is essential to building trust and credibility with investors.
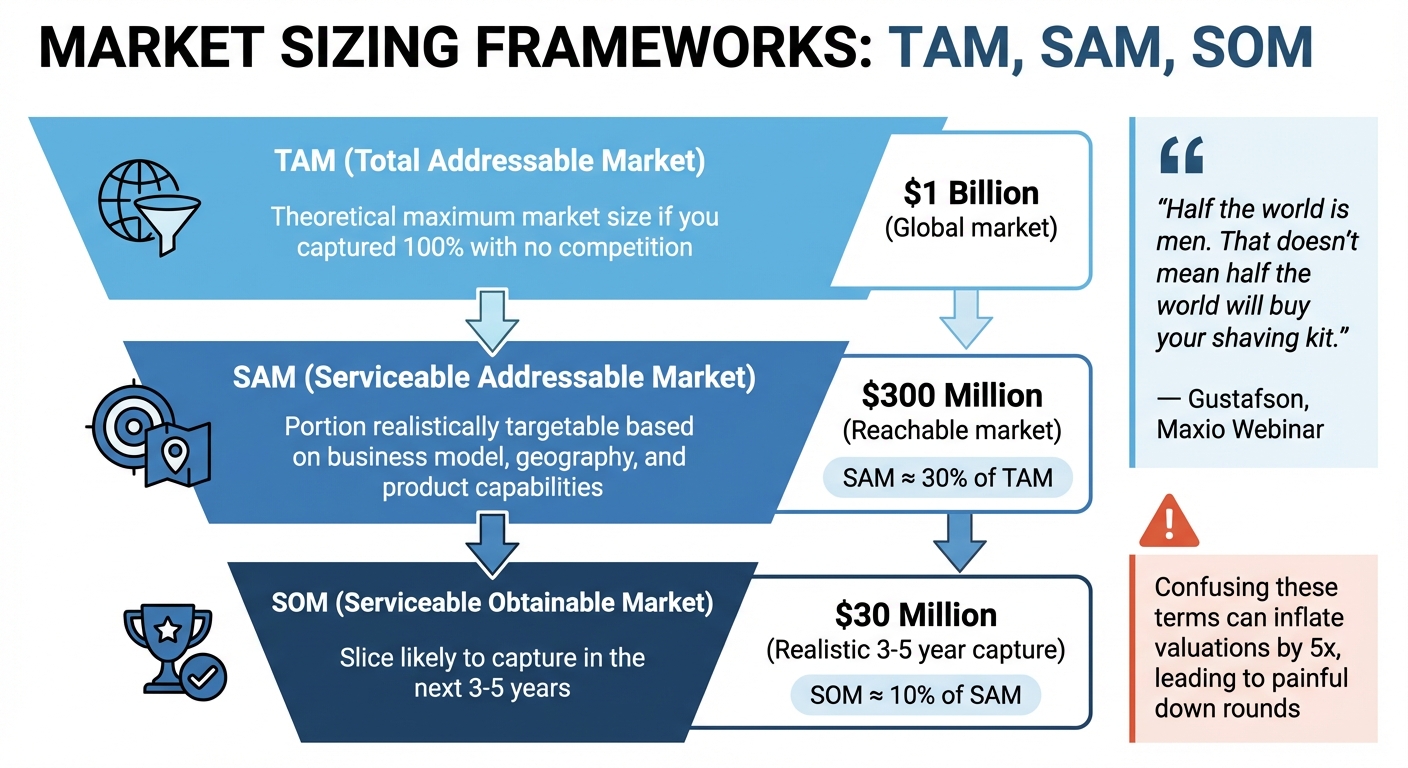
Confusing Total Market with Addressable Market
Misunderstanding market segmentation is another common error. Here’s a quick breakdown:
- Total Addressable Market (TAM): The theoretical maximum market size if you captured 100% of it, with no competition.
- Serviceable Addressable Market (SAM): The portion you can realistically target based on your business model, geography, and product capabilities.
- Serviceable Obtainable Market (SOM): The slice you’re likely to capture in the next 3-5 years.
"Half the world is men. That doesn't mean half the world will buy your shaving kit." - Gustafson, Maxio Webinar
Confusing these terms often leads to inflated valuations, which can backfire. For example, overestimating your short-term market share might inflate your valuation by 5x, setting you up for painful down rounds later. While venture capital firms often look for a TAM above $1 billion, you can’t just claim a bigger number without considering real-world constraints. With enterprise B2B SaaS sales cycles now stretching to 9-12 months (up from 6-9 months pre-2023), overly ambitious projections are a red flag.
The key takeaway? Your market size calculations need to reflect the competitive landscape and actual customer behavior - not just theoretical possibilities. Avoiding these common mistakes can help you make smarter decisions and allocate resources more effectively.
Why Bottom-Up Validation Works Better
Bottom-up validation offers a more grounded and reliable way to estimate market size compared to top-down methods. Instead of relying on broad industry figures and hoping to capture a portion, this approach starts with real-world data - actual customers, specific pricing, and verified demand. While it requires more effort, it delivers results based on what customers actually do, not on speculative analyst forecasts.
For example, bottom-up sizing forces you to quantify your customer base and validate pricing. Imagine identifying 45,000 potential customers, each willing to pay $15,000 annually. That calculation substantiates a $675 million Serviceable Addressable Market (SAM).
"VCs dismiss top-down sizing because it reveals nothing about whether you understand your actual customers. Bottom-up sizing does the opposite." - Zimt
The formula is simple: Number of Customers × Revenue per Customer (ARPU). The difference lies in how you arrive at those numbers. Let’s say your target market is "Series A SaaS startups in the US with 11–50 employees." By having over 40 customer conversations to validate pricing, instead of relying on assumptions, your estimates become much harder to challenge. Founders who use this structured approach often see success rates three times higher. This method also sets the stage for understanding unit economics and gaining insights from real users.
Building Estimates from Unit Economics
Unit economics form the backbone of accurate market sizing. For SaaS businesses, focus on metrics like ARPU, churn, and upsell revenue. In marketplaces, calculate your take rate - your share of the Total Gross Merchandise Value (GMV) - instead of using the full GMV. For hardware, consider factors like unit price, cost of goods sold (COGS), replacement cycles, and sales of related consumables or services.
Precision is key when defining customer segments. Rather than saying "restaurants", narrow it down to "fast-casual restaurants in the US with 2–10 locations and $1M–$10M in annual revenue". Tools like LinkedIn Sales Navigator, Crunchbase, or government databases (e.g., Census Bureau or Bureau of Labor Statistics) can help you count potential customers. Multiply the customer count by your validated pricing, and you’ll arrive at a market size that can stand up to scrutiny.
For startups in their first year, aiming for a Serviceable Obtainable Market (SOM) penetration rate of 2% to 5% is ambitious but achievable. In B2B sectors, only 5% to 15% of potential customers typically evaluate new solutions each year. Including clear math in your pitch - like "45,000 customers × $15,000 ACV = $675M SAM" - shows investors that your projections are well-researched.
| Business Model | Key Unit Economic Data Points | Calculation Method |
|---|---|---|
| SaaS | ARPU, Churn Rate, Expansion Revenue | (Total Users) × (ARPU) |
| Marketplace | GMV, Take Rate, Transaction Frequency | (Total GMV) × (Take Rate %) |
| Hardware | Unit Price, Replacement Cycle, Attach Rate | (Units Sold) × (LTV including consumables) |
| General Retail | Average Order Value (AOV), Purchase Frequency | (Total Customers) × (AOV) × (Frequency) |
Numbers alone won’t cut it - direct feedback from customers is just as critical.
The Role of Primary Research
Talking directly to customers confirms that the problem you’re solving is real. This involves conducting interviews, surveys, and other demand tests before building your product. By combining numerical estimates with customer input, you create a stronger foundation for your market validation.
Aim for 15–20 customer interviews to identify behavioral patterns and pain points. Use frameworks like The Mom Test to focus on past behaviors (e.g., "Tell me about the last time you dealt with this problem") rather than hypothetical future actions (e.g., "Would you buy this?"). People often struggle to predict their own future actions, so prioritize what they’re currently spending to address their problems, even if it’s on manual workarounds or imperfect solutions.
"The best answer [to price point questions] references actual customer conversations, LOIs, or early pricing tests. Second-best is competitive pricing analysis. Weakest is 'that's what we think we can charge.'" - Vicki Politis, Founder, DeckToVC
Beyond interviews, landing page tests can gauge willingness to pay. Direct traffic to a page with realistic pricing and track actions like "Request Demo" or "Reserve Early Access" as indicators of purchase intent. Online forums like Reddit can also provide valuable insights - search for emotionally charged discussions where users describe frustrations using terms like "nightmare" or "impossible". These revealed preferences (what people actually do) are far more reliable than stated ones (what they say they might do).
Backing your projections with documented sources - whether customer conversations or specific data tools - gives investors confidence that your numbers are grounded in reality, not speculation.
Why Real-Time Data Matters for Market Sizing
Markets are constantly shifting. Consumer preferences evolve, new competitors emerge, and economic conditions change faster than any annual report can keep up with. Despite this, many founders still lean on static benchmarks that are outdated almost as soon as they're published. In fast-moving sectors like fintech or e-commerce, market values can swing by 15% or more each year. Relying on outdated data for market size calculations can lead to flawed assumptions - and bad decisions.
Limitations of Static Benchmarks
Static data sources have a short shelf life in today’s rapidly changing markets. Reports published 12 to 18 months ago often miss key developments like shifts in consumer behavior, new entrants in the market, or regulatory changes. For example, by 2025, the average enterprise B2B SaaS sales cycle has stretched from 6–9 months to 9–12 months due to tighter procurement processes. Benchmarks from even relatively recent reports fail to capture these kinds of trends.
"Industry reports from 2019 are irrelevant in 2025. Markets shift, competitors emerge, and customer behavior changes. Stale data undermines your entire analysis." - Zimt
Using outdated data can lead founders to overestimate market size, basing projections on inflated figures instead of focusing on what’s realistically achievable today. Top-down estimates drawn from these static benchmarks often produce misleading results. Considering that 90% of startups fail - many due to misjudging the market opportunity - depending solely on outdated data isn’t just a bad idea; it’s a recipe for disaster. These shortcomings highlight the importance of accessing constantly updated, actionable insights.
Using AI Tools for Real-Time Insights
AI tools are changing the game for market sizing by replacing static data with real-time intelligence. Instead of waiting for quarterly reports, these platforms analyze live consumer data, monitor social media sentiment, and track competitive activity continuously. The demand for this kind of immediate insight has fueled the real-time analytics market, which is expected to grow from $25 billion in 2023 to $193.71 billion by 2032.
Consider AT&T's use of H2O.ai's platform in 2025. By replacing traditional, reactive fraud detection methods with predictive, real-time optimization, AT&T reduced fraud-related incidents by 80% and saved approximately $17 million annually. Similarly, Canva adopted Anyscale’s AI platform, which sped up model training by 12 times, cut cloud costs nearly in half, and scaled generative AI features to serve 170 million users.
For startups, tools like IdeaFloat's Smart Market Sizing provide a way to calculate market opportunities with data that investors can verify. Instead of relying on outdated TAM, SAM, and SOM figures, these platforms pull from up-to-date data sources, offering precise calculations that reflect current market conditions. They also help validate pricing strategies through real-time customer feedback and competitor analysis. When pitching to investors, showing that your numbers are based on live, credible data - not a report from 2022 - can make a huge difference.
Combining Top-Down and Bottom-Up Approaches
Both top-down and bottom-up methods have their strengths and weaknesses. Top-down provides a big-picture perspective but often inflates numbers, while bottom-up offers a more grounded view but can underestimate potential. By combining these methods, you can refine your market size estimates and address the limitations of each approach. This approach aligns with the growing need for real-time, adaptable data analysis in today's market.
For example, if your top-down estimate is $1 billion, but your bottom-up calculation comes to $300 million, that discrepancy highlights flawed assumptions. Perhaps your top-down data includes segments you can’t realistically reach, or your bottom-up assumptions are overly cautious.
Finding and Fixing Discrepancies
When there’s a large gap between the two methods, it’s a signal to revisit your assumptions. If your bottom-up estimate is much lower than your top-down figure, you might be defining your customer base too narrowly or setting prices too low. On the other hand, if your bottom-up number exceeds the total market size from top-down reports, you could be overestimating your reach or double-counting customers.
"When both methods converge within 20-30%, you can be confident your estimate is solid. When they diverge, you've found a productive question to answer." - Zimt
Take the example of an organic dog food company in December 2025. Their bottom-up calculation - 500,000 dog owners multiplied by 20% penetration and $300 annual spend - yielded a $30 million estimate. Meanwhile, their top-down estimate - $1 billion total pet food market × 15% organic share × 60% dog segment - came to $90 million. The $60 million gap led them to reassess assumptions about market penetration and potential overestimation in their top-down data.
To resolve these gaps, compare criteria like geography, industry, and pricing across both methods. Ask yourself: Is your average revenue per user realistic when compared to competitors? Run sensitivity analyses to test how changes in pricing or acquisition timelines might affect your numbers.
Using Triangulation to Validate Estimates
After addressing basic discrepancies, triangulation can further strengthen your estimates. This involves validating your market size using three independent data sources. Start with your bottom-up calculation based on customer counts and unit economics. Add a top-down report from a trusted source like Gartner or IDC. Then, include a third method, such as analyzing comparable public companies or using a value-theory approach to estimate the economic value your product generates.
If all three methods fall within a 20%-30% range, your estimate is likely robust and defensible. However, if the variance exceeds 20%, your market definition may need refinement. Investors in startups expect this kind of thorough analysis, as it demonstrates that you’ve tested your assumptions and understand both the broader market trends and the detailed economics of your business.
For instance, in February 2026, a B2B recruiting platform validated its $141 million TAM by segmenting tech startups into early-stage (15,000 companies), growth-stage (3,500 companies), and scale-ups. They applied seat-based pricing ranging from $3,600 to $43,200. After excluding 40% of growth companies using incompatible applicant tracking systems, they refined their SAM to $106 million. By cross-referencing industry reports and SaaS benchmarks, they confirmed their estimates were realistic.
IdeaFloat's Smart Market Sizing simplifies this process by automating triangulation. The platform pulls data from industry reports, competitor pricing, and customer behavior to calculate TAM, SAM, and SOM. It highlights discrepancies and helps you address them before pitching to investors. This integrated method ensures your market analysis is thorough and credible, meeting the rigorous expectations of stakeholders.
How to Calculate Market Size Accurately
Accurately calculating your market size is crucial for securing investor confidence and making informed business decisions. Let’s break it down into a clear, actionable framework.
Defining and Segmenting Your Market
Start by defining your market around the problem you solve, not just the product you offer. For example, instead of saying, "we're in the project management software market", focus on the specific need: "we help remote teams coordinate asynchronous work across time zones." This approach ensures you don’t underestimate your Total Addressable Market (TAM) by being too narrow in scope.
Use the TAM-SAM-SOM framework to refine your market:
- TAM (Total Addressable Market): The broadest possible market for your solution.
- SAM (Serviceable Available Market): The portion of TAM you can realistically serve.
- SOM (Serviceable Obtainable Market): The part of SAM you can capture based on your current capacity.
When narrowing your market, exclude segments you can’t serve due to factors like language barriers, regulatory restrictions (e.g., HIPAA compliance), or platform incompatibility. For instance, if your product only integrates with Salesforce, exclude companies using other CRMs. Tools like LinkedIn Sales Navigator or the US Census Bureau can help you pinpoint the number of companies that fit your Ideal Customer Profile (ICP).
For institutional Series A funding, investors generally expect a TAM of at least $1 billion. However, a strong position in a smaller market can sometimes be more attractive than competing in an oversaturated space.
Once your segments are defined, validate them with reliable data.
Using Verified Data Sources
Your market size calculation is only as strong as the data behind it. Always cite your sources, including the publication year and growth rates like the Compound Annual Growth Rate (CAGR), if relevant. Trusted sources for technology markets include Gartner, IDC, and Forrester. For broader business data, turn to Statista, IBISWorld, or reports from McKinsey and PwC.
Combine industry reports with specific customer counts to get a more accurate picture. For example, if you’re targeting mid-market SaaS companies, LinkedIn Sales Navigator ($99/month) can help you identify businesses with 100–1,000 employees in your target industries. Then, cross-reference this data with your Average Revenue Per User (ARPU) to build a bottom-up estimate.
Platforms like IdeaFloat's Smart Market Sizing streamline this process by pulling data from multiple verified sources and calculating your TAM, SAM, and SOM. It even highlights discrepancies between the top-down and bottom-up methods, so you can address any gaps before presenting your findings to investors. This ensures your market estimates are as reliable as possible.
Setting Realistic Capture Rates
Once your market is defined and supported by credible data, the next step is to establish realistic capture rates. Avoid making overly optimistic claims like capturing 1% of a $10 billion market without considering the challenges of customer acquisition. Instead, calculate your SOM based on your actual operational capacity.
Here’s a practical guideline:
- Years 1–2: Expect to capture 0.1–0.5% of your SAM as you build traction.
- Year 3: Aim for 1–2% as you achieve product-market fit.
- Year 5: With a scaled go-to-market strategy, reach 3–5% of your SAM.
Achieving over 20% market share typically takes a decade and requires becoming the dominant player in your category.
To calculate SOM, consider your sales team’s capacity. For example, if you have two Account Executives who can each close 50 deals annually at an average contract value of $10,000, your first-year revenue would be $1 million. Grounding your capture rates in real sales capabilities ensures your market opportunity is realistic.
In 2014, Slack projected a conservative SOM of $50 million (3.3% of their $1.5 billion SAM) for year 5 during their Series B pitch. They surpassed expectations, achieving over $200 million in annual recurring revenue by year 5 and later sold to Salesforce for $27.7 billion.
Slack’s well-reasoned capture rate helped them secure investor confidence and establish credibility.
Finally, validate your assumptions by benchmarking against competitors. If the market leader generates $50 million in a market claimed to be worth $5 billion, projecting a 10% capture rate ($500 million) is likely unrealistic. Your SOM should align with the revenue projections in your financial model - any discrepancies will raise red flags with investors.
Conclusion
Flawed market sizing can erode investor trust and steer founders toward opportunities that don’t actually exist. As Mindcapital aptly put it, "Most market sizing is fiction dressed up as research. Founders spend weeks creating beautiful slides with charts and percentages that have no connection to reality". And the consequences? Strategic missteps, missed revenue targets, and startups that appear unprepared before they even get off the ground.
To avoid these traps, a straightforward, evidence-based approach is key. Start by focusing on validated customer counts and unit economics. Use up-to-date, verified data, and apply realistic capture rates that align with your sales capabilities. Forget the overly optimistic idea of capturing 1% of an enormous market. Instead, validate your estimates through triangulation. If your top-down and bottom-up figures align within 20–30%, you’re likely on the right track.
AI tools can speed up market sizing, but they’re not foolproof. A 2024 experiment revealed that AI platforms overestimated a market by 17 times - projecting $33.6 billion when the actual market size was just $1.98 billion. The lesson? As Strategex noted, "The answer is hybrid intelligence - combining AI's computational power with human strategic thinking. AI is transforming consulting, but it's not replacing consultants".
By blending human expertise with smart technology, you can refine your estimates and build credibility. Tools like IdeaFloat's Smart Market Sizing leverage verified data to calculate TAM, SAM, and SOM while identifying inconsistencies, giving you the precise, investor-ready metrics you need.
Ditch the guesswork. Rely on evidence to pinpoint exactly how many customers you need to sustain your business. Start by dominating a well-defined, small market. That’s the playbook for building a company that lasts.
FAQs
When should I use top-down vs. bottom-up sizing?
Top-down sizing is great when you need quick, big-picture estimates. It works by using broad industry data to gauge potential. While it’s fast, it often relies on assumptions that can lead to overestimations. This approach is useful when precision isn’t critical, like during early brainstorming sessions.
On the other hand, bottom-up sizing delivers more accurate and detailed numbers. It starts with real customer data and scales it up, making it ideal for investor presentations or critical strategic decisions. While it takes more effort to gather and analyze the data, the results are far more dependable.
How many customer interviews do I need to validate pricing?
To validate pricing, it's generally suggested to conduct 15 to 20 customer interviews. This number strikes a balance, providing enough qualitative insights to gauge customer willingness to pay while fine-tuning your pricing strategy.
What capture rate is realistic for my first 3 years?
A realistic expectation for your market capture rate during the first three years usually falls between 1% and 10% of your Serviceable Obtainable Market (SOM). This range depends on factors like your industry, market conditions, and overall strategy. For early-stage startups, it’s common to see rates closer to 1% to 3%, largely due to limits on capacity and the hurdles of acquiring customers.
To refine your estimate, consider key variables such as customer lifetime value, sales cycles, and competition. These elements play a critical role in shaping a more accurate projection.
Related Blog Posts

Get the newest tips and tricks of starting your business!